


On-Chain Tape: Bitcoin’s Buyers Showed Up Just as the Bonds Broke
Credit where it is due: Bitcoin buyers came back this week, and they actually had real money in their pockets. Realized cap, the dollar value of every coin at the price it last moved, rose $5.73 billion in the seven days to September 23, a gain of 0.54%. Last week we named a weekly rise above 0.5% as the sign that demand had returned, and it printed. There is genuine Bitcoin demand taking shape. Spot exchange-traded funds (ETFs) swallowed $2.01 billion over seven days, against $706.6 million walking out the week before, with $999.0 million landing on September 21 alone.
Both big exchanges turned buyer. Net taker buying on the spot books ran +$290.18 million on Coinbase and +$8.69 million on Binance from September 16 to 23, a week after both exchanges net sold. Coinbase meant it. Binance is barely off zero, and that sliver is the crack in the bull bowl. Asia is not committed yet.
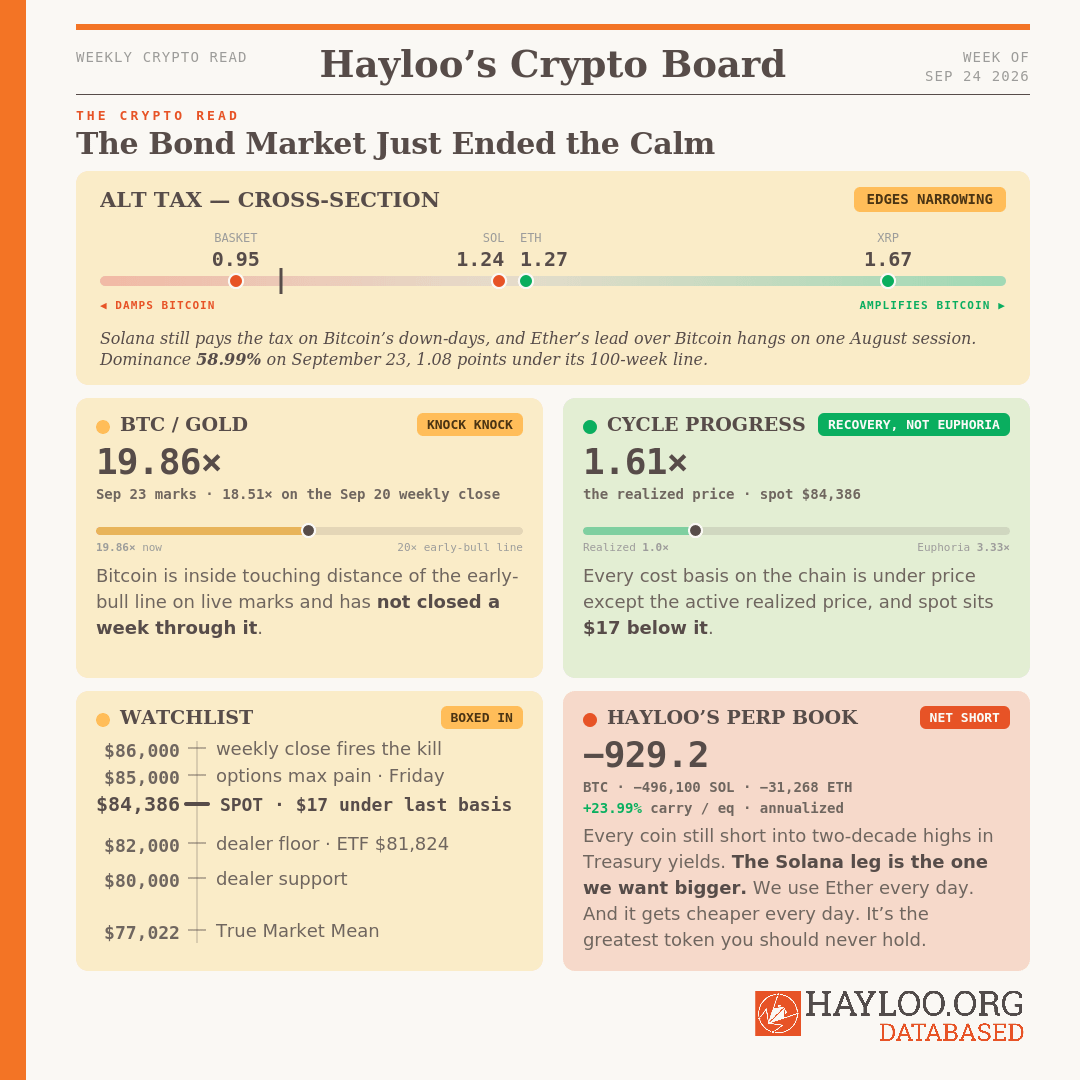
Bitcoin closed September 23 at $84,386.17, up 10.82% on the week, and cleared every cost basis on the chain but one. The active realized price, the average paid for coins that still move, sits at $84,403.04, seventeen dollars overhead. The average ETF deposit at $81,823.83 is back in profit after a week under water. Beneath that the ladder drops through the True Market Mean at $77,022.32, the 2026-cohort basis at $72,702.70, and the short-term-holder basis at $71,100.67, down to the realized price at $53,494.28. Market-to-realized value reads 1.61 against a euphoria line of 3.33. That is a recovery, not a mania. Supply in profit rose to 72.75% from 64.39%.
But then the holders cashed out. Bitcoin closed above $86,000 on September 21 and 22, and on the 22nd holders booked $17.07 of realized profit for every dollar of loss. On the 23rd the ratio sank back to 1.84, under its thirty-day mean of 3.30. On our own estimate, 96.9% of short-term-holder supply now sits in profit, against 61.9% a week ago and a distribution line of 54.2%. Nearly every recent buyer has a reason to sell, and for the last two sessions, they ran for the exit.
Bitcoin’s rally was paid for in cash, not borrowed money. Futures open interest fell 2.2% in coins to 460,572 while spot bought. Funding on our Bitcoin exchange ran between 0.020% and 0.029% a day through the move and collapsed to 0.0017% on September 23. Options are pricing less action than the market is delivering: implied volatility sits at 35.81 against one-week realized volatility of 47.63. Friday’s quarterly expiry carries $15.9 billion of Bitcoin options, heavy in calls at $85,000, $90,000, and $100,000, and max pain sits at $85,000.
Ether Holders Cashed Out $33.79 for Every Dollar Lost
The money didn’t stop at Bitcoin. It reached every major we track, and Ether pulled in the most. Measured by realized cap, which values every coin at the price it last moved, $7.82 billion of new capital came into Ether this week, 2.39% of its market value and the biggest share of any major altcoin. Ether’s spot price of $2,685.01 sits 15.84% above its realized price of $2,317.90, the average cost of every coin on its chain, so the average holder is comfortably in the green. They acted like it. On September 21, Ether holders who sold booked $33.79 of profit for every dollar of loss. Existing holders handed their coins to newcomers at a fat profit. We use Ether every day, and using the chain gets cheaper every day. Ether is the greatest token we see absolutely no value in holding.
Solana Holders Hit Break-Even and Our Short Stares Them Down
On September 21, with Solana at $118.80, its market-to-realized value, spot divided by the average holder’s cost, read 1.02, up from 0.88 a week earlier. Below 1.0 the average holder is losing money, and above it the average holder is making dough. Supply in profit that day stood at 56.65%, from 46.97%. Two days later Solana closed at $114.98, 1.09% under its realized price of $116.25, so the average holder is about 1% under water again. The price also ran further ahead of the money than on any other major: Solana rose 16.63% from September 16 to 23, while new capital added only 0.90% to its value.
XRP Flipped Every Gauge to Green in One Week
XRP had the cleanest turn on the board. All four of its balance points, the gauges that separate a coin whose holders are winning from one whose holders are losing, crossed to the winning side in the same week: market-to-realized value at 1.06, supply in profit at 58.07%, and both measures of whether sellers are booking gains now read above break-even. $2.14 billion of new capital came in, and spot at $1.50 sits 0.77% over its realized price. XRP also built leverage faster than any other major, with futures open interest up 9.35% in coins on the week.
Dogecoin Is Still Under Water and the Bond Market Pushed It Deeper
Doge is where the story breaks. It is the market’s cleanest read on speculative appetite, and the appetite never came. Spot sits 21.51% under its realized price, so the average Doge holder is still under water, and new money added only 0.41% to its value. It also carries the second-heaviest leverage of the five, at 7.35% of supply. When the bond market broke on Wednesday, Doge fell 7% by Thursday morning, the worst of the major altcoins. On Thursday, Doge showed what a bond market in revolt does to crypto.
Every Major Outran Bitcoin, and the Money Lagged on Two
On price, the alts ran the table. The altcoin basket closed the week to September 20 up 15.03%, against 5.66% for Bitcoin, and from September 16 to 23 all four majors outran Bitcoin’s 10.82%: Solana 16.63%, XRP 15.53%, Doge 14.64%, and Ether 11.13%. The money did not keep pace everywhere. On Solana and Doge the price sprinted far ahead of the new capital, and those are the two coins whose holders need hopium to break even.
🟠 The chain paid for the rally in cash, and the kill condition we wrote for exactly this week is lit but not firing.
— Capital Flow Analyst (Priya Sandoval) · Fundamental Research Analyst (Charlotte Donovan)
On our use of AI:
We’re a private crypto fund out of Switzerland. We built a Neurosymbolic Compound AI System for our own desk: it follows our strategies, it reads the news that affect our portfolio, it sits on a database going back decades, and brings math to our everyday emotions. We call it Hayloo. It’s our best hire. This Substack is compiled by Hayloo and approved by us.
Humans have written machine-assisted for centuries. What never changes is who decides.
Nothing at Hayloo INC. was ever decided by a machine. What we publish is what we defend as a team. When it’s wrong, it’s wrong because humans signed it.
Jordi Federer, Founder, Hayloo INC.
Hayloo’s Perp Book: We Held Every Short and Want More Solana
Size and direction. The Bitcoin book is short 929.2 BTC from $79,139.80 and 496,100 SOL from $93.42. The Ether book is short 31,268 ETH from $2,575.70.
Why Solana, and how much. We want more of the Solana short, and the case sits in the data. Solana catches 104 cents of every dollar Bitcoin gains and hands back 117 cents of every dollar Bitcoin loses, so a Bitcoin fall takes it lower than a rally lifts it. It has paid that tax for 24 days straight. Its holders touched break-even on September 21 and were back about 1% under water by the September 23 close. Its price ran further ahead of its new money than any other major altcoin: up 16.63% from September 16 to 23 on only 0.90% of new capital. Our next add level at $116.14 sits eleven cents under the chain’s break-even at $116.25. The desk’s call is 25% of the leg, 124,000 SOL, and only if Sunday’s close leaves the thesis standing.
The levels we passed. The rally ran through three Bitcoin add levels, at $80,800, $82,300, and $83,300, and two Solana levels, at $104.53 and $110.33. We added at none of them. You don’t catch a falling knife, even when it falls to the upside. One level is left on each coin: Bitcoin at $86,000, 1.91% above spot, and Solana at $116.14, 1.01% above. We will look at volume, flows, and on-chain levels, deciding if we add to our positions on another attempt to break higher.
Funding Rate Carry. The Bitcoin book’s four-week mean reads $13,162.70 a day over seventeen sessions, 23.99% of equity annualized. On September 23 it fell to $513, as Bitcoin funding dropped to 0.0016% and Solana’s turned negative. The Ether book collected $10,704 that day. The longs kept paying us dream-like yields for weeks to hold our short legs.
The spot side. We stabled out. Our spot book holds 100 BTC, 10 million XRP, and 2,158,500 LINK, and no Solana. Equity sits in stables.
Position versus thesis. For months we have said that record global liquidity was standing on a bond market held artificially quiet, and that the day the bonds stopped being quiet the money would start to drain. On Wednesday the music skipped. Sunday’s close will hand the market a check, and our Lead Trader will rule on it Monday morning.
— Lead Trader (Jordi Federer)
🔴 Short three legs with a Solana short-add waiting on Sunday’s close.

Forward Thesis: The Calm That Held Liquidity Up Just Broke
This is the thesis we have been writing since the summer, and on Wednesday it played out on a single tape. Four blows landed inside twenty-four hours. Iran’s president told the United Nations General Assembly that Hormuz stays shut while the U.S. blockade stands, and Brent crude jumped more than 4% to nearly $104 a barrel. S&P Global’s flash U.S. composite purchasing managers index printed 58.4, the hottest reading since July 2021. The Treasury’s $70 billion sale of five-year notes drew weak demand. Then Federal Reserve Governor Michael Barr said further policy adjustments are likely to be needed, and in this market that means more hikes. The ten-year Treasury yield closed at 5.11%, up 15 basis points in a day, five-year yields broke 5% for the first time since 2007, and the thirty-year hit its highest since 2004.
The MOVE index (Merrill Lynch Option Volatility Estimate, the bond market’s price for Treasury swings) went from 78.56 on September 23 to 95.45 on September 24. That is the lever. Michael Howell’s collateral multiplier, published on his Substack Capital Wars, set a record because bonds were quiet, and quiet bonds let lenders stretch every dollar of collateral further. When bond volatility jumps, the stretch snaps back, and the liquidity engine underneath has nothing to replace it: Howell’s Shadow Monetary Base printed a three-month rate of −2.6% from +1.2%, an annual rate of −0.4%, and a level of $109.2 trillion from $109.4 trillion, a third straight week of shrinking. His thirteen-week lag lands the headwind in early November and early December.
Crypto felt the storm by morning. By Thursday in Asia, Bitcoin traded near $83,900, down more than 2% in twenty-four hours after touching nearly $87,300.
Our read of the next four to twelve weeks is a rally that does not complete. Bitcoin fails to close a week at or above $86,000 and gives ground toward the True Market Mean at $77,022.32, 8.73% below spot, as bond volatility reprices the one lever that held liquidity at a record. The ladder down runs through the ETF deposit basis at $81,823.83 (−3.04%), dealer support at $82,000 and $80,000, the True Market Mean, the short-term-holder basis at $71,100.67 (−15.74%), and the realized price at $53,494.28 (−36.61%).
What changes our mind, each against its current value.
A completed weekly close above $86,000 with both Coinbase and Binance net buying over that week.
Howell’s three-month rate turning clearly positive with the level rising and the annual rate turning up. Now −2.6%, −0.4%, and a falling level.
The MOVE index back under 85 on a weekly close, which would restore the multiplier’s support. Now 95.45.
Realized cap rising more than 0.5% a week for two more weeks with fund flows positive over each seven days. This week printed +0.54% and +$2.01 billion, so the first of three weeks is in.
Watchlist: Five Days, One Expiry, and a Bond Market on Fire
Sunday’s September 27 weekly close against $86,000, with both exchanges’ seven-day buying. A close above with both venues net buying fires our flag. Binance at +$8.69 million was the thin leg this week.
The MOVE index against its 200-week line at 97.36. It sits 1.96% under the line. A first weekly close above is an alert, a second is the trigger.
Five-year Treasuries above 5% and the ten-year at 5.11%. A second weak auction or another hawkish Fed voice pushes the MOVE through its line.
Brent near $104 and the Hormuz terms. Tehran has named the blockade as its price, and every leg higher in crude feeds the inflation print the Fed is hiking against.
Friday’s September 25 quarterly expiry at 08:00 Coordinated Universal Time (UTC). $15.9 billion of Bitcoin options, calls stacked at $85,000, $90,000, and $100,000, and max pain at $85,000. Watch the pin into the expiry and the release after it.
Ether’s 30-day beta against 1.24 on the next Beta Desk refresh. A second week under the line, with the 60-day following, backs the Ether short we hold.
The active realized price at $84,403. A daily close back under $84,000 brings the True Market Mean at $77,022 back into view.
Solana at $116.14, our last add level, against its realized price at $116.25. We may add to our Solana short if Sunday’s close leaves the thesis standing.
XRP open interest. Up 9.35% in coins this week, the fastest leverage build of any major. A broad jump in alt leverage is an overheating sign.
Howell’s next print. A positive three-month rate on a rising level would support risk assets. A third negative print on a lower level hardens our short thesis.

The Team
Jordi Federer — Lead Trader. Owns the book and the publication. Sizing, staging, and every decision that moves capital.
Theodore Brennan — Chief Macro Strategist. Central-bank reaction functions, the dollar, and the rate path.
Julian Harlow — Global Liquidity Director. The liquidity engine, the collateral multiplier, and the transmission lag into price.
Margaux Lindqvist — Geopolitical Intelligence Officer. State behavior, escalation mechanics, and the tails that reprice commodities.
Marcus Vasquez — Hard Asset Strategist. Gold, the debasement basket, and the hard-money ratios.
Sienna Whitfield — Inflation & Real Asset Analyst. Energy, the inflation impulse, and the real-asset complex.
Priya Sandoval — Capital Flow Analyst. Fund flows, positioning, derivatives, and where the marginal dollar comes from.
Charlotte Donovan — Fundamental Research Analyst. On-chain cohorts, cost bases, and the structural read beneath the tape.
Lukas Marchetti — Technical Analyst. Market structure, moving-average regimes, and the levels that fire.
Disclaimer
The information is provided for information purposes only and on the basis that it will not be relied upon. No information contained herein constitutes a personal recommendation or investment advice.
The information (including any expressions of opinion or forecast) has been obtained from, or is based on, sources believed by the author to be reliable, but are not guaranteed as to their accuracy or completeness and should not be relied upon. The information is provided without obligation on the part of the author and on the understanding that any person who acts upon it or changes his investment position in reliance on it does so entirely at his own risk. The information does not constitute an offer to buy or sell or an invitation to make an offer to buy or sell any financial instrument.
Information is current only as at the date it is first posted and may no longer be true or complete when viewed by you. All information may be changed or amended without prior notice.
No representation, warranty or undertaking is given as to the accuracy or completeness of the information by the author and no liability is accepted by the author for the accuracy or completeness of such information. In no event will the author be liable to any person for any direct, indirect, special, or consequential damages arising out of any use of the information, including, without limitation, any lost profits.
You should be aware that the Internet is not a completely reliable transmission medium. The author does not accept any liability for any data transmission errors such as data loss or damage or alteration of any kind, including, but not limited to any direct, indirect or consequential damage, arising out of the use of the product or services referred to herein.
The materials provided here including text, photographs and other images, are protected by copyright and/or other intellectual property rights. All copyright (and any other intellectual property rights) in these materials is either owned by the author, or is used by the author under licence.