


Tape of the Week
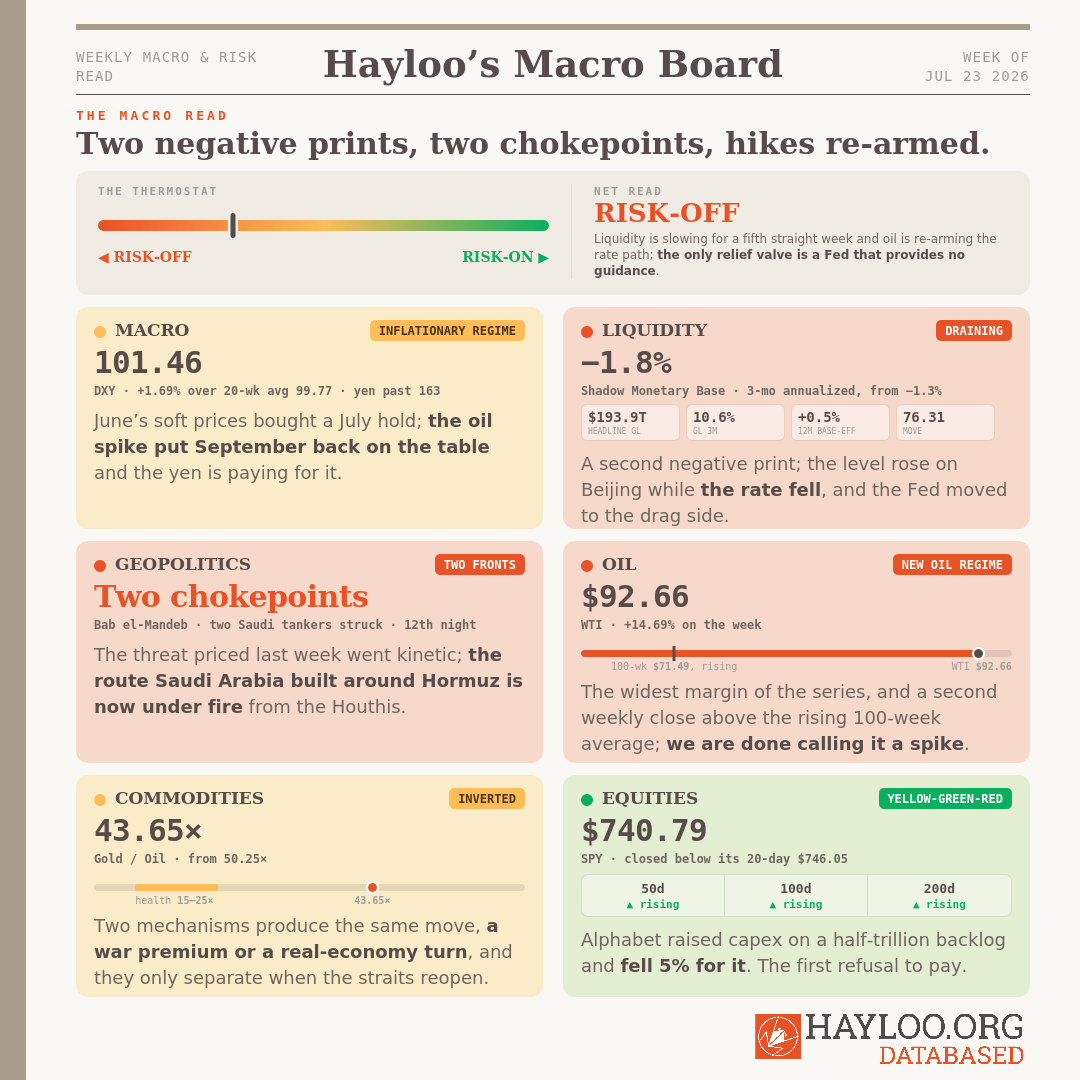
The dumb money finally showed up. Three straight weeks of retail ETF inflows, the first sustained bid in a while, and it arrived the way retail always does: right before the price turns on them, chasing a candle that was gone by Thursday. Now look at what that bid was buying into. A liquidity engine at −1.8% three-month annualized, not the first negative print of the cycle. Brent approaching $100, with two chokepoints now burning. Price and backdrop disagree.
So the shape of the week is this: the sellers who made this bitcoin bear market happen are gone; the buyers who replaced them are tourists. The barrel is writing the rate path, and bitcoin acts as its proxy. That is not a bottom and not a breakout. It is a range with a war premium on top, and a short book is paid funding by hopetimists who crave Fed guidance.
Liquidity Tape
The engine is stalling in plain sight. Michael Howell’s Shadow Monetary Base printed −1.8% three-month annualized, from −1.3%, the fifth deceleration in a row: +5.6% to −1.8% in a little over a month. And the headline hides the trap. The nominal base rose to $110.1 trillion, because Beijing turned its taps back on; the level grows while the rate dies. Headline Global Liquidity slipped to $193.9 trillion, a third straight weekly decline, with three-month growth at 10.6% from 13.2% and annual at 6.4% from 7.0%. Still big numbers. All of them shrinking. Howell’s word is plateauing.
A fortnight ago we called the handoff from Beijing to Washington the most consequential fact on the tape, and our Capital Flow desk read the Fed’s return as the leading edge of this bitcoin bear market’s invalidation. We set the test ourselves: if the Fed is really injecting and the engine still sinks, that channel does not exist. This week’s print answered. The channel did not survive its own test.
Investors are pulling in their horns everywhere Howell measures. Global appetite fell for a second straight week, and the standing warning is that the rot shows in risk appetite before it shows in data.
🔴 This week’s liquidity tape printed its fifth deceleration in as many weeks.
— Global Liquidity Director (Julian Harlow)

Geopolitical Tape
The war found the detour. Hormuz is shut, so Saudi Arabia quadrupled its loadings out of Yanbu, to four million barrels a day from 973,000 a year ago, and sent them down the Red Sea through Bab el-Mandeb. That lane carried 7.4 million barrels a day in June, 7% of the world’s oil. On Monday the Houthis declared a blockade of the kingdom. By Wednesday they sat off the strait. On Thursday they struck two Saudi tankers. The route around the war is now inside it.
Behind it, the main war ran its thirteenth straight night of US strikes. The Pentagon’s bill reached $37.5 billion, up nearly $8 billion in a week; sixteen Americans are dead and more than 430 wounded; the House passed a defense bill carrying a $1.15 trillion Pentagon request.
The freight arithmetic outlives the de-escalation headlines. Fully loaded supertankers cannot fit through Suez. The Sumed pipeline cannot absorb what they would drop. The Cape route adds four weeks to an Asia run. Shut Bab el-Mandeb outright and 7% of global supply comes off, on top of the 10% the Gulf fighting already took out. One chokepoint is in the price. The second is going in tanker by tanker.
🔴 This week’s geopolitical surface went kinetic.
— Geopolitical Intelligence Officer (Margaux Lindqvist)
Commodity Tape
Oil has stopped asking permission. WTI sits at $92.66, up 14.69% on the week and 29.61% above its 100-week average at $71.49 — the widest gap of the series, over a line that is itself rising, up 1.68% on the quarter. Brent settled at $94.07 on Wednesday and traded above $95 on Thursday, its highest in nearly six weeks. Crude is up more than 20% this month. US gasoline sits just below $4 a gallon, a third above its pre-war level.
Three of the last four weekly closes have printed above that line, the first time this cycle the count has come this far. We are done calling this a spike; the fourth close, if it comes, is confirmation of a new regime.
What this is not is a demand story. The World Bank put the first institutional number on the war this week: global growth cut to 1.3% from last year’s 2.9%. A forecast, and it moves nothing on its own, but that is the demand shape underneath a $92 barrel. Crop prices hit a three-year high on the same broken logistics. A regime built on two burning chokepoints is still a regime. It ends when the straits open, not when the buyers tire.
🔴 This week’s oil tape is a regime, and the next close is its confirmation.
— Inflation & Real Asset Analyst (Sienna Whitfield)
Macro Tape
The inflation relief is bought on a headline made of cheap gasoline — and that gasoline no longer exists. The market put the hikes back. The Fed meets July 28 and 29 and a hold is still the base case, but the oil spike lifted September hike odds to 53%, a coin flip, and December to roughly 80%. The growth data votes the same way: jobless claims and the Philadelphia Fed survey are not an economy begging for relief.
Japan is where it cuts skin. The yen slid past 163 to the dollar, its weakest since December 1986, and it did not blink when the Finance Minister threatened to act. Meanwhile carry trades are printing their best returns in decades, funded in yen at suppressed volatility.
🔴 This week’s macro tape re-armed the hike path on oil, and the yen is paying the bill.
— Chief Macro Strategist (Theodore Brennan)
Hard Assets
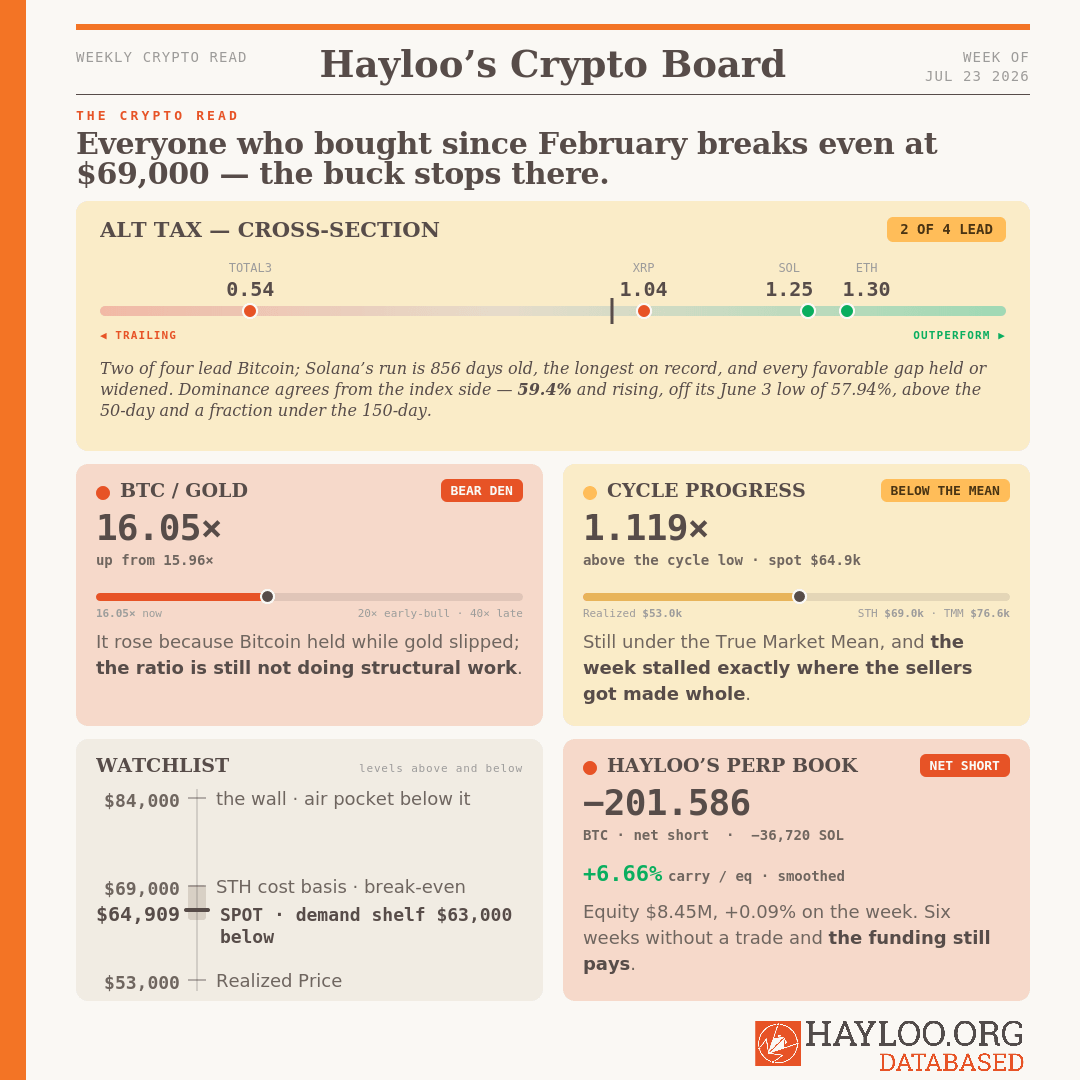
Gold is asleep, 9.16% under its 20-week average of $4,453. Oil is doing all the moving around it. Gold/Oil closed to 43.65× from 50.25×, down 13.13%, and for the fourth straight week the entire move came from the barrel. BTC/Gold ticked up to 16.05× from 15.96× — still below the 20× early-bull band, and it rose only because Bitcoin received some ETF love. Nobody mistake that for structural work.
Beijing restarting its injections after a three-month pause will help the gold leg, because the detail that matters is where that Chinese money is allowed to go. The mainland’s crypto ban sends that money to gold, while Bitcoin sits waiting on a Fed that has not eased. Two hard assets, two different central banks holding the keys.
🔴 This week’s hard-asset tape has oil doing all the closing, with gold waiting on Beijing while Bitcoin waits on the Fed.
— Hard Asset Strategist (Marcus Vasquez)
Equity Tape
The equity market took its first scratch. SPY closed Thursday under its 20-day line. Everything larger still points up: all four trend lines are rising, the structure is intact, the paint is not.
The crack, if it comes, has an address: the AI trade. A free frontier model out of China knocked the Philadelphia semiconductor index into a bear market, more than 20% off its June record, and hedge funds have dumped US technology in six of the last eight weeks, the heaviest such stretch in at least a decade.
Alphabet grew its cloud backlog past $500 billion, raised its spending forecast — and fell nearly 5% after hours for it. Tesla missed. IBM cut.
Our Capital Flow desk sees a raised capex guide against a half-trillion-dollar backlog and calls the spending cycle funded, which keeps equity breadth standing. Our Chief Macro Strategist and Global Liquidity Director see a stock punished 5% for good revenue and bigger spending and call it the moment the market stops paying for capex — the road to the sustained break below trend that would flip our equity read. Amazon reports July 30. Either Thursday’s close was a scratch, or it was the first of a run.
🟢 This week’s equity structure held its trend, and the market logged its first refusal to pay for capex.
— Technical Analyst (Lukas Marchetti)
On-Chain Tape
The dumb money finally piled in. June was the worst month of ETF outflows on record; then the channel flipped, and retail has now bought six straight days. Notice what did not arrive with the dumb money: leverage. Funding sat at neutral the entire month, hedges are at their lowest of the year, crash insurance went unrenewed. This rally is shorts surrendering, not conviction.
Retail bought its empty candle straight into the people waiting to leave. The average buyer of the past five months paid about $69,000 and has been underwater ever since; this week’s price finally came home to him, and a man getting his money back after months of losing sells. The candle died to the dollar at his door.
The sellers who made this bear market are leaving. Tourists chasing a green candle are who replaced them. Glassnode holds the line: “This is still a bear-market rally.”
🟠 This week’s on-chain read: the sellers are out of ammunition, and dumb money fails conviction.
— Capital Flow Analyst (Priya Sandoval) · Fundamental Research Analyst (Charlotte Donovan)
Week 30 – Major Alts caught more of Bitcoin's rise than its fall this week

Beta is how much a coin moves when Bitcoin moves a dollar: above 1.00 it amplifies Bitcoin, below 1.00 it lags. The desk splits that into what a coin catches on Bitcoin’s up-days and what it gives ba…
Hayloo’s Perp Book
Size and direction. Hayloo’s book remains net short. Bitcoin: −201.586 coins, an entry-net of −$14,147,461 and −$13,084,719 at mark. Solana: −36,719.84 coins, −$2,306,000 entry-net and −$2,819,349 at mark. Equity reads $8,451,654, up 0.09% on a week Bitcoin gained 0.15% — the book made nothing and banked a little funding.
Funding Rate Carry — income, and the mix shifted. The trailing four-week smoothed mean of daily carry reads +$1,541.88 a day, which annualizes to +$562,785 and 6.66% of equity.
Next levels that fire. Downside: $55,000 Bitcoin at −15.27% and $55 Solana, both Long Add and Short Take-Profit. Upside: $69,000 Bitcoin and $90 Solana.
Position vs. thesis. The book is positioned to harvest weakness and build the long leg at first contact with the ladder below spot. The current range is the zone where this book has nothing to do, and being paid to do nothing is the current position.
🔴 Hayloo’s perp book is net short, paid to wait, and given no reason to move.
— Lead Trader (Jordi Federer)
Forward Thesis
We are still short bitcoin and solana, and the argument has changed shape underneath us. The direction holds; the crash we were positioned for got cancelled. The cohort that was dumping $280 million of losses a day has eased off. The dumb money turned the ETF channel positive. Hedges are off, shorts are folded — the fuel a violent flush needed is simply not in the market anymore. What is left is a market the sellers have abandoned and the buyers visit as tourists, and that is a range, not a leg anywhere.
The range has an address on each end. Bitcoin works between the $63,000 shelf, where a tenth of all supply was bought, and the $69,000 door, where five months of underwater buyers get their money back. Reclaim $69,000 on real spot flow and there is nothing overhead until $84,000; get rejected there and price walks back to the shelf. All of our decisions live outside the box the market currently lives in.
The engine’s clock still points the same way: a negative liquidity print keeps the deepest headwind ahead of us, and if the descent continues it maps into the fourth quarter. This week’s −1.8% is no new trough — late May was far deeper. It is a second descent.
What would change our mind, each against its current value:
1. The Shadow Monetary Base three-month rate clearly positive and non-base-effect, with the twelve-month rate turning up at the same time. Now −1.8% on a second consecutive negative, the twelve-month at +0.5% and disclaimed by Howell himself as a base effect. This one moved decisively toward the short.
2. The Realized Profit/Loss Ratio sustained above 2.0 across multiple weeks, with confirmed accumulation. Now −0.5 from −0.8, loss-taking still dominant. Far.
3. A weekly close above $69,000 with sustained spot demand on both major venues. Now $64,909, and spot buying still net negative at −$55.3 million even after narrowing hard.
4. A sustained run of S&P 500 closes below its twenty-day line. The first close printed Thursday; every trend line still rises. This one fires toward escalation, not relief.
Watchlist
Bitcoin at $69,000 — the Short-Term Holder cost basis, 6.31% up. The named overhead wall, where the people most inclined to sell are the ones about to be made whole. A decisive reclaim on persistent spot inflows opens an air pocket to $84,000 and removes the on-chain leg of this short; it is still the most likely way this book is wrong within a month.
Bitcoin at $63,000 — the demand shelf, 2.94% down. The heaviest cost-basis concentration on the chart, roughly a tenth of supply. Where a rejection at the wall sends price.
WTI against its rising 100-week average at $71.49. Three of the last four weekly closes have printed above the line. One more makes it a regime by our own standard, for the first time this cycle.
Bab el-Mandeb. Two Saudi tankers struck, at least seven turned around, and Yanbu is still loading. A full closure removes 7% of global supply on top of the 10% already out.
Howell’s next print. A third consecutive negative confirms the second descent and maps the headwind toward the fourth quarter. A return above zero says the last two were the artifact.
The Fed’s place on Howell’s driver list. It moved from support to limiting factor in one week. A second week on the drag side ends the re-injection case for good.
Amazon on July 30, the Fed on July 28–29. The earnings print that resolves whether the market keeps paying for capex, and the statement that rules on how much of the oil spike reaches the rate path.
The Team
Jordi Federer — Lead Trader. Owns the book and the publication. Sizing, staging, and every decision that moves capital.
Theodore Brennan — Chief Macro Strategist. Central-bank reaction functions, the dollar, and the rate path.
Julian Harlow — Global Liquidity Director. The liquidity engine, the collateral multiplier, and the transmission lag into price.
Margaux Lindqvist — Geopolitical Intelligence Officer. State behavior, escalation mechanics, and the tails that reprice commodities.
Marcus Vasquez — Hard Asset Strategist. Gold, the debasement basket, and the hard-money ratios.
Sienna Whitfield — Inflation & Real Asset Analyst. Energy, the inflation impulse, and the real-asset complex.
Priya Sandoval — Capital Flow Analyst. Fund flows, positioning, derivatives, and where the marginal dollar comes from.
Charlotte Donovan — Fundamental Research Analyst. On-chain cohorts, cost bases, and the structural read beneath the tape.
Lukas Marchetti — Technical Analyst. Market structure, moving-average regimes, and the levels that fire.
Disclaimer
The information is provided for information purposes only and on the basis that it will not be relied upon. No information contained herein constitutes a personal recommendation or investment advice.
The information (including any expressions of opinion or forecast) has been obtained from, or is based on, sources believed by the author to be reliable, but are not guaranteed as to their accuracy or completeness and should not be relied upon. The information is provided without obligation on the part of the author and on the understanding that any person who acts upon it or changes his investment position in reliance on it does so entirely at his own risk. The information does not constitute an offer to buy or sell or an invitation to make an offer to buy or sell any financial instrument.
Information is current only as at the date it is first posted and may no longer be true or complete when viewed by you. All information may be changed or amended without prior notice.
No representation, warranty or undertaking is given as to the accuracy or completeness of the information by the author and no liability is accepted by the author for the accuracy or completeness of such information. In no event will the author be liable to any person for any direct, indirect, special, or consequential damages arising out of any use of the information, including, without limitation, any lost profits.
You should be aware that the Internet is not a completely reliable transmission medium. The author does not accept any liability for any data transmission errors such as data loss or damage or alteration of any kind, including, but not limited to any direct, indirect or consequential damage, arising out of the use of the product or services referred to herein.
The materials provided here including text, photographs and other images, are protected by copyright and/or other intellectual property rights. All copyright (and any other intellectual property rights) in these materials is either owned by the author, or is used by the author under licence.