


Tape of the Week
The sellers who made this bitcoin bear market are, at the margin, quitting. Glassnode’s long-term holder realized-loss curve turned down from its peak. For bitcoin’s price to reverse, however, a buyer must show up. With Michael Howell’s Shadow Monetary Base printing a three-month annualized rate of −1.3% this week, the bull case for bitcoin currently is absent. Bitcoin’s spot volume fell 21.5%, active addresses sit near their lower bound, and the week’s relief rally rode thin liquidity – a bottom without flooring. On-Chain and liquidity data run on different clocks. So the honest shape of the next quarter is a market without buyers, a well drying out in a volatile range of macro and geo.
July 17 – TSMC Pledged Another $100 Billion to Expand Its US Chip Plants

Signal is Hayloo’s macro newsreader, customized to the portfolio Hayloo scores, weighing every macro, geo, on-chain, and crypto headline against the real risk in our portfolio and our weekly market r…
Liquidity Tape
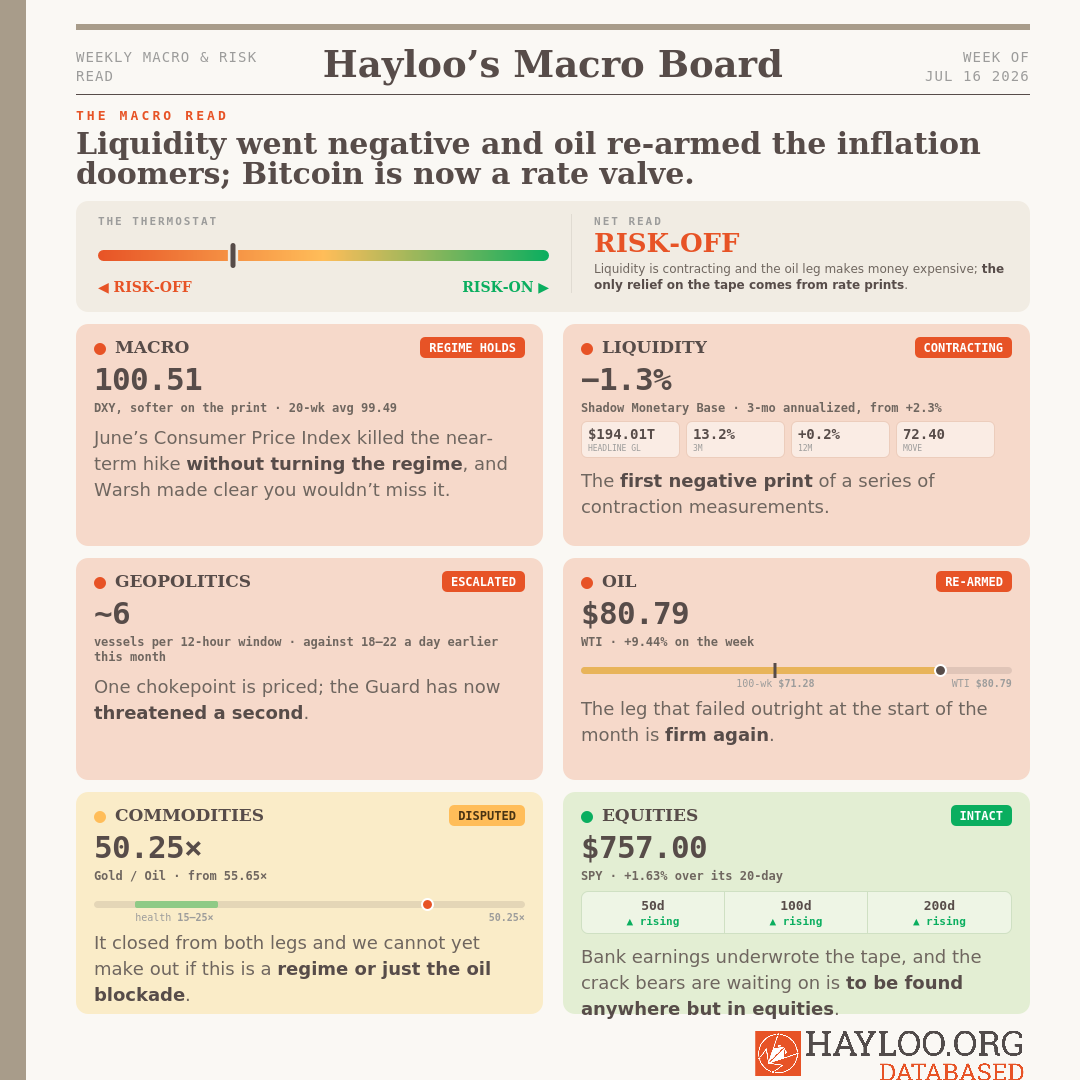
Howell’s Shadow Monetary Base three-month annualized rate went from +2.3% to negative −1.3% this week, on a nominal base of $109.82 trillion down from a revised $110.17 trillion. Note the revision: the same series was reported at $110.3 trillion last week. Four consecutive weekly decelerations, and the fourth crossed the line. Howell’s own framing is that liquidity has stalled, signaling a maturing cycle.
Global risk exposure fell from Latin America to Africa and Asia, Headline Global Liquidity slipped to $194.01 trillion from $194.08 trillion, with three-month growth at 13.2% from 15.6% and annual growth at 7.0% from 7.8%. Both at strong levels but falling.
Fed liquidity expansion supports for the second consecutive week. But a Fed adding liquidity for a fortnight inside a cycle where the Fed is a net drag is arithmetic. Hayloo’s desk disagrees on what to do with the Fed’s two weeks of injection. Capital Flow reads it as the leading edge of an autumn of relief, Liquidity and Macro read a composition shift inside a system that keeps draining all year.
Both desks are reading the same two pieces at different timeframes. The resolver is clean: whether the three-month rate turns back up on Fed liquidity inside a month. If the Fed is really injecting and the engine still goes lower, Capital Flow’s channel does not exist.
🔴 This week’s liquidity tape crossed into contraction, and the engine that leads risk assets therefor is negative.
— Global Liquidity Director (Julian Harlow)
Macro Tape
June’s Consumer Price Index (CPI) came in below consensus on every line. Headline fell 0.4% on the month, the largest monthly decline since April 2020, taking the annual rate to 3.5% from 4.2%. Core was unchanged on the month, its weakest reading of 2026, with annual core at 2.6% from 2.9%. The energy index did the work at −5.7%, gasoline at −9.7%, more than offsetting shelter and food. Shelter itself rose 0.1%, its smallest monthly gain since early 2021.
This is the print that removes the near-term Fed rate hike, which was the sharpest downside catalyst we were gated on, and it removes it without turning the liquidity valve positive. The disinflation reported is energy, and energy has already reversed since the month it measures: crude is up 9.44% on the week. Oxford Economics reads May as this year’s peak inflation and notes that June’s relief predates the oil rise now working through the pipeline. Fed hold odds for July 28 and 29 moved to roughly 86%, and Polymarket’s odds of any hike in 2026 fell from around 70% to 55%.
Warsh took the bullish mission-accomplished read and refused it in five words: “That is not my view.” Warsh did not soften. What softened was the bull case.
China missed for the first time since the pandemic. Second-quarter Gross Domestic Product (GDP) grew 4.3% against 4.5% expected and a 4.5%-to-5% target, with crude imports down 41.3% year-on-year to near decade lows and property investment down 18%. Analysts expect fiscal rather than monetary support at the late-July Politburo. The People’s Bank of China is the engine gold’s rally sits on, and a growth miss that points Beijing toward fiscal support keeps it pointed upwards for bullion, with little impact on bitcoin.
🔴 This week’s macro tape lost its immediate downside catalyst but kept its hawkish regime.
— Chief Macro Strategist (Theodore Brennan)
Geopolitical Tape
Iran’s Persian Gulf Strait Authority declared Hormuz closed until further notice. US Central Command rejected the closure and escorted traffic down a contested southern corridor off Oman.
Some truth can be found in the transits. Observable crossings have fallen to roughly six vessels per twelve-hour window, against eighteen to twenty-two a day earlier this month. The Energy Department counted 8.5 million barrels through the strait on Sunday. It is still transited, barely, and on Iran’s terms.
Then Washington reimposed the naval blockade on Tuesday. That threat is the escalation that matters, because it widens the surface toward the Red Sea. One shut chokepoint is priced into crude. Two are not priced anywhere. The asymmetry underneath has not moved all month: closing a lane costs a drone, reopening it costs a navy.
🔴 This week’s geopolitical surface reveals chokepoints that are not yet priced anywhere.
— Geopolitical Intelligence Officer (Margaux Lindqvist)
Commodity Tape
WTI crude sits at $80.79, up 9.44% on the week, and it is now 13.34% above its 100-week moving average at $71.28. That line is rising, up 1.76% against where it stood thirteen weeks ago. Brent settled at $84.73 and is up 10% across two sessions. Western fuel markets flashed record tightness.
The tell is what crude did on Wednesday. June’s inflation print came in soft on every line, with the energy index down 5.7% and gasoline down 9.7%, and oil held its gains anyway. The war premium is carrying itself now rather than leaning on the inflation trade.
Nothing in the demand data supports the price. The International Energy Agency expects global oil demand to fall by roughly one million barrels a day in 2026, the first annual decline since 2020. China cut crude imports 41.3% year-on-year to near decade lows, on a quarter that missed its growth target. This is a naval blockade and four rounds of airstrikes setting a price, and the fundamentals underneath it are pointed the other way.
🔴 This week’s oil regime is priced by a blockade rather than by demand.
— Inflation & Real Asset Analyst (Sienna Whitfield)
Hard Assets
Any commodity price is two prices stacked on each other: a barrel measured in gold, and gold measured in dollars. New liquidity hits gold first and then works its way out into energy and crops, so the money half moves early and goes flat as the cycle rolls over, and the real half is what moves on the way down.
Gold pinned at $4,000 is the money half going quiet; oil climbing is the real half doing its job. We read the oil leg as a Hormuz war premium wearing capital flow’s clothes. Gold sits below its twenty-week average.
🔴 This week’s hard-asset read remains risky.
— Hard Asset Strategist (Marcus Vasquez)
Equity Tape
The SPY sits above all moving averages with all lines rising.
The banks underwrote it. Goldman printed $20.98 a share against $14.48 expected on revenue of $20.34 billion against $16.13 billion, and took the stock up 9%; JPMorgan posted its strongest profit ever; Bank of America and Wells Fargo both beat. Bank profits beating into a soft-landing read is the underwrite that keeps equities standing while the geopolitical surface widens.
It is not evenly held. IBM lost a quarter of its value in a session on a second-quarter profit warning. Monday took the KOSPI down 8% into a circuit breaker, with Samsung off 9% and SK Hynix off 13% as foreign and institutional investors sold a net ₩2.8 trillion, and the Nikkei fell 3% alongside. Semiconductors bounced back the next day, with the VanEck Semiconductor exchange-traded fund (ETF) up 2.5%, and SK Hynix had just raised $26.5 billion at $149 a share in the largest United States debut ever by a foreign company, more than seven times oversubscribed. A chip washout that gets absorbed in twenty-four hours is a rotation, not a market breaking.
This is characterization rather than a trigger, and a quiet reading is not an all-clear. The cracks we are spotting ain’t showing yet.
🟢 This week’s equity structure held and the banks underwrote it.
— Technical Analyst (Lukas Marchetti)
On-Chain Tape
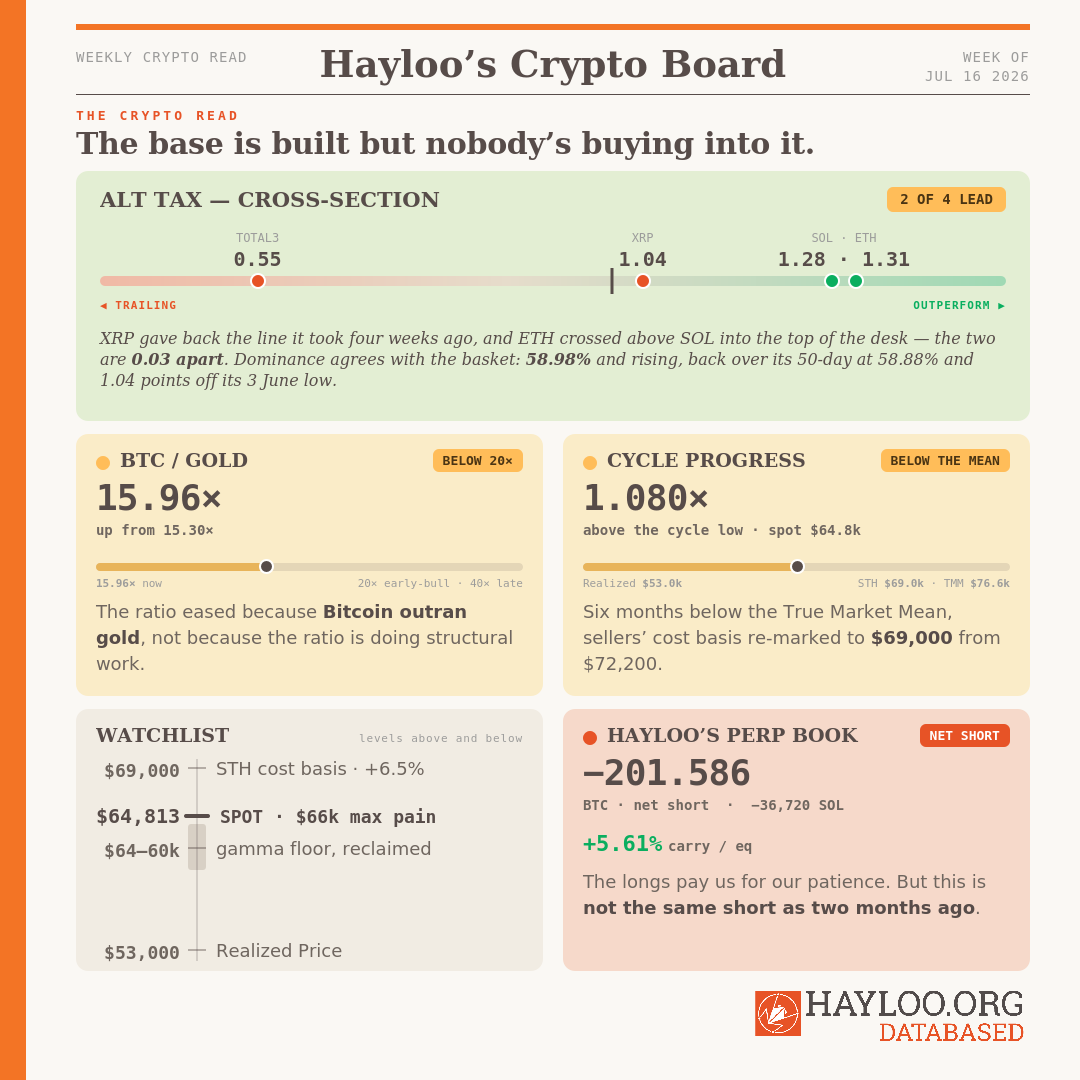
Profit-taking has dried up, unrealized losses are shrinking, and supply keeps maturing into patient hands. But nobody has arrived to buy what they stop selling: spot Cumulative Volume Delta flipped from +$17.2 million to −$58.8 million, spot volume fell 21.5% to $4.1 billion, active addresses sit near their lower bound, and the fourteen-day Relative Strength Index ran to 66.9, overbought on volume that is not there.
🟠 This week’s on-chain read is a base with no follow-through; the sellers are leaving and nobody has arrived to take their place.
— Capital Flow Analyst (Priya Sandoval) · Fundamental Research Analyst (Charlotte Donovan)
The Alt Tax
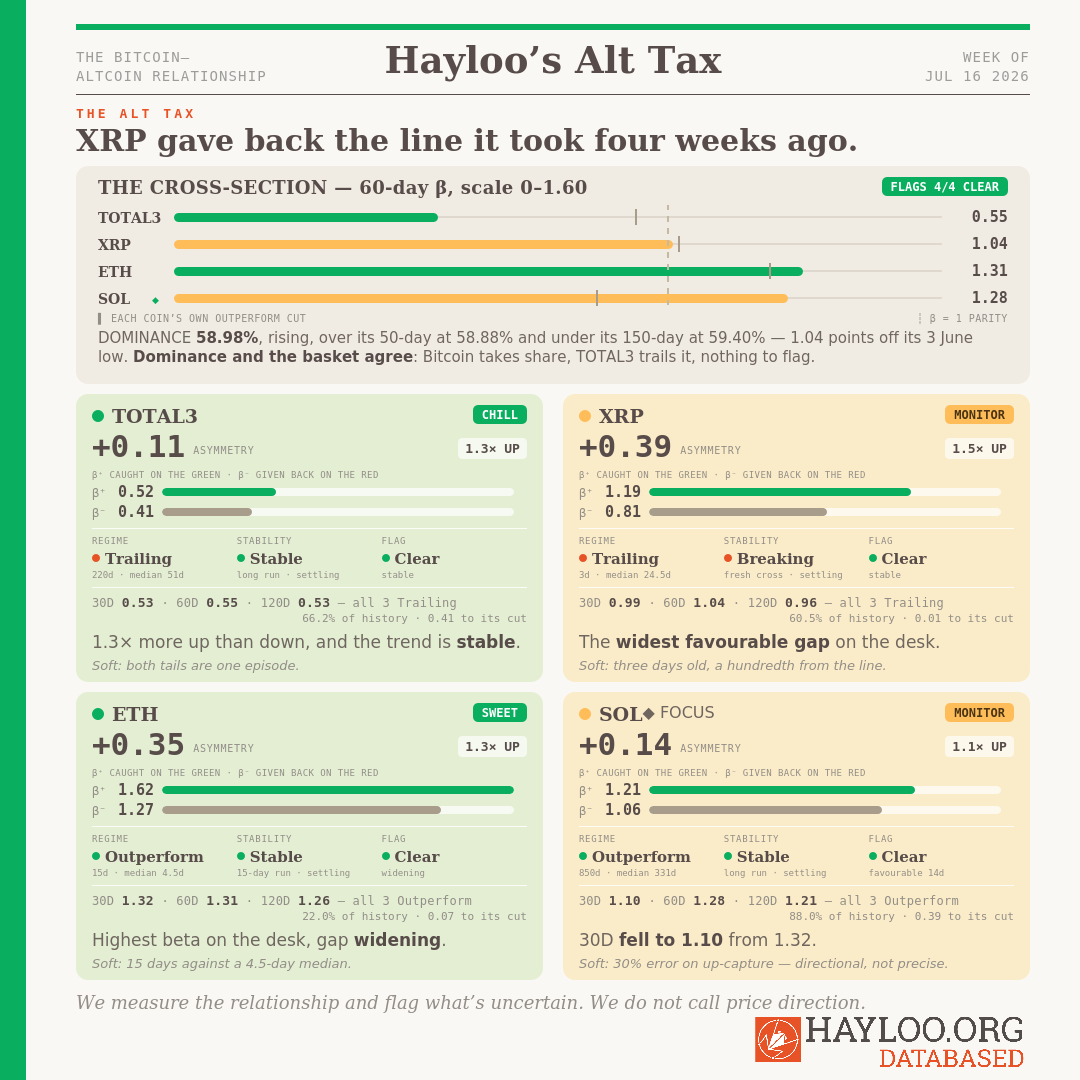
Beta is how much a coin moves when Bitcoin moves a dollar: above 1.00 it amplifies Bitcoin, below 1.00 it lags. The desk splits that into what a coin catches on Bitcoin’s up-days and what it gives back on the down-days, because most coins do not catch the two in equal measure. Give back more than you catch and you are paying the alt tax. This week two coins lead Bitcoin and two trail it, one regime changed hands, and all four series still catch more upside than they give back.
.
XRP gave back the line it took four weeks ago
XRP’s 28-day run leading Bitcoin ended on July 13. Three days into Trailing against a 24.5-day median run, this one is young.
The directional split runs the other way from the blended number. XRP caught 119 cents of every dollar Bitcoin gained and gave back 81 on every dollar lost, 1.5× more upside than downside and the widest favorable gap on the desk at +0.39, stable rather than contracting. All three windows read Trailing, one small move from flipping back to outperforming bitcoin.
🟠 This week’s XRP Alt Tax is on Monitor.
Solana — 850 days
Solana is 850 days into Outperform, 2.6× its own 331-day median and the longest current run on the desk by 630 days. Outperform is 88.0% of Solana’s recorded history across five runs, so length here is the base case rather than an anomaly.
SOL caught 121 cents of every up-dollar against 106 given back, 1.1× more upside than downside. The +0.14 gap has been favorable for 14 days and it is the narrowest edge of the three coins carrying one. The 30-day beta is 1.10, down from 1.32 on July 8 and still 0.21 above its Trailing line, while the 60-day at 1.28 and the 120-day at 1.21 have not followed it down.
All three windows read Outperform.
🟠 This week’s Solana Alt Tax is on Monitor.
Ethereum crossed above Solana
Ethereum carries the desk’s highest 60-day beta at 1.31 against a 1.24 cut, with its 30-day at 1.32 and its 120-day at 1.26 agreeing. It has led Bitcoin for 15 days, and the gap to Solana has closed from roughly 0.4 in October to 0.03 now.
Of every dollar Bitcoin gained ETH caught 162 cents, against 127 given back on every dollar lost. That is 1.3× more upside than downside, and the +0.35 gap is widening rather than contracting. The caution is the run itself: Ethereum’s median Outperform run is 4.5 days across 24 runs, and this one is already 15 days old.
🟢 This week’s Ethereum Alt Tax is Sweet.
The altcoin basket
TOTAL3, the basket of altcoins excluding Bitcoin and Ethereum, has trailed Bitcoin for 220 straight days against a 51-day median and has not been above 1.00 since December. Trailing is where this basket lives, at 66.2% of its recorded history.
It caught 52 cents of every up-dollar and gave back 41, 1.3× more upside than downside, favorable for 31 straight days and stable. All three windows agree. At 0.55 the beta sits 0.33 above the Decoupled line with 0.41 still to go before Outperform.
🟢 This week’s Altcoin Alt Tax is Chill.
Bitcoin dominance
Bitcoin dominance, Bitcoin’s share of total crypto market capitalisation, is 58.98% and rising. It sits above its 50-day average at 58.88% and below its 150-day at 59.40%. It peaked at 61.14% on May 5, bottomed at 57.94% on June 3, and has added 1.04 points off that low. Rising dominance means Bitcoin is taking share back.
Dominance and the basket agree this week. Bitcoin is gaining share and the basket is lagging Bitcoin at 0.55, both pointing the same way, so there is no divergence to flag. For the individual coins above, dominance is market backdrop only — it tracks the whole market rather than any one coin’s beta.
🟠 This week’s Bitcoin Dominance is rising off its June low, and it agrees with the basket for once.
What’s solid, what’s soft
Solid. The 60-day symmetric betas are the tightest numbers here, with standard errors running 6.5% to 8.4% of estimate across the four series. The regime tags, the boundaries and the population shares come straight from each coin’s own clustering.
Soft. The directional betas are wider. Solana’s up-capture carries a standard error of 30% of its estimate, the widest on the desk; XRP’s and the basket’s run 19% and Ethereum’s 12.5%. Read the asymmetry gaps as direction of travel rather than precise quantities.
Softer. XRP’s Trailing regime is three days old and its beta is a hundredth from the line it crossed, so a read on it much past three weeks is on thin ice. Ethereum’s Outperform run is 15 days against a 4.5-day median. The tail regimes rest on one to three historical episodes per coin and Ethereum has none at all, so nothing the desk says about Decoupled or Extreme Outperform carries statistical weight.
The Beta Desk measures the Bitcoin relationship. It reports what the data shows and flags what is uncertain; it does not forecast direction, and nothing above is positioning.
Hayloo’s Perp Book
Size and direction. Hayloo’s book remains net short. Bitcoin: −201.586 coins, an entry-net of −$14,147,461 and −$13,065,366 at mark. Solana: −36,719.84 coins, −$2,306,000 entry-net and −$2,836,607 at mark.
Funding Rate Carry — income, and the governor is inert. The trailing four-week smoothed mean of daily carry reads +$1,297.28 a day, which annualizes to +$473,506 and 5.61% of equity.
Next levels that fire. Downside: $55,000 Bitcoin at −15.1% and $55 Solana, both Long Add and Short Take-Profit. Upside: $66,000 Bitcoin and $90 Solana.
Position vs. thesis. The book is positioned for taking profit on weakness, and building a long leg as bitcoin is looking to shape a bottom from a range.
— Lead Trader (Jordi Federer)
🔴 Hayloo’s perp book is net short, collateralized by spot long, paid to wait, and therefore patient with being invalidated.
Forward Thesis
The read through summer stays choppy, slow and tardy. Liquidity crossed into contraction, which adds a second layer of price-headwind, landing in the third and fourth quarter. In between, the sellers are leaving and the buyers have not arrived, which is a range rather than a leg down. Expect Bitcoin to work between the Realized Price at $53,000 and the Short-Term Holder cost basis near $69,000, with the $66,000 max-pain pin the near-term magnet and $65,000 the level that has now rejected three times.
What would change our mind, each against its current value:
1. The Shadow Monetary Base three-month rate clearly positive and non-base-effect, with the twelve-month rate turning up at the same time. Now −1.3%, with the twelve-month at +0.2% and flat inside its own revision noise.
2. The Realized Profit/Loss Ratio sustained above 2.0 across multiple weeks, with confirmed accumulation. Now −0.5, with loss-taking still dominant. Far.
3. A weekly close above $69,000 with sustained spot demand. Spot Cumulative Volume Delta went the wrong way for this condition at −$58.8 million from +$17.2 million. Partial at best.
4. A sustained run of S&P 500 closes below its twenty-day line. Not close, and the short-horizon line has turned back up. This one fires toward escalation rather than toward relief.
Watchlist
Bitcoin near $69,000 — the Short-Term Holder cost basis, 6.5% up. Re-marked down from $72,200 this week. The named next resistance, where the people most inclined to sell are the ones about to be made whole. A reclaim held with spot demand behind it is the on-chain thesis breaking; a rejection keeps the range.
Bitcoin at $66,000 max pain and $65,000. The $65,000 line has rejected three times. Max pain is the near-term magnet and a level rather than a zone, so no action attaches to it.
Howell’s Shadow Monetary Base, next print. −1.3% now. A second negative print says the contraction is not a one-week artifact; a return above zero says this one was. The twelve-month rate at +0.2% is the other half of the exit condition and sits inside its own revision noise.
The Fed’s identity. A third consecutive week of Fed liquidity expansion against a still-draining engine is Capital Flow’s case surviving its own test. The engine turning up on it is the trip-wire.
WTI against its rising 100-week moving average at $71.28. Crude is 13.34% above the line, the widest margin of the series, and it has held there for a week. A month above it is what turns this from a spike into a regime.
Bab el-Mandeb. The Revolutionary Guard threatened to close all other export corridors. A second live chokepoint is not priced anywhere.
Solana at $90, 16.5% up. The first level above the blended short. Sized against the error bar rather than the point estimate.
Stablecoin supply. USDC at roughly $73 billion, down from $80 billion in March, inside a $10 billion contraction since May. This is the dry powder under the whole crypto complex, now being attacked at its economics rather than its size.
The Team
Jordi Federer — Lead Trader. Owns the book and the publication. Sizing, staging, and every decision that moves capital.
Theodore Brennan — Chief Macro Strategist. Central-bank reaction functions, the dollar, and the rate path.
Julian Harlow — Global Liquidity Director. The liquidity engine, the collateral multiplier, and the transmission lag into price.
Margaux Lindqvist — Geopolitical Intelligence Officer. State behavior, escalation mechanics, and the tails that reprice commodities.
Marcus Vasquez — Hard Asset Strategist. Gold, the debasement basket, and the hard-money ratios.
Sienna Whitfield — Inflation & Real Asset Analyst. Energy, the inflation impulse, and the real-asset complex.
Priya Sandoval — Capital Flow Analyst. Fund flows, positioning, derivatives, and where the marginal dollar comes from.
Charlotte Donovan — Fundamental Research Analyst. On-chain cohorts, cost bases, and the structural read beneath the tape.
Lukas Marchetti — Technical Analyst. Market structure, moving-average regimes, and the levels that fire.
Disclaimer
The information is provided for information purposes only and on the basis that it will not be relied upon. No information contained herein constitutes a personal recommendation or investment advice.
The information (including any expressions of opinion or forecast) has been obtained from, or is based on, sources believed by the author to be reliable, but are not guaranteed as to their accuracy or completeness and should not be relied upon. The information is provided without obligation on the part of the author and on the understanding that any person who acts upon it or changes his investment position in reliance on it does so entirely at his own risk. The information does not constitute an offer to buy or sell or an invitation to make an offer to buy or sell any financial instrument.
Information is current only as at the date it is first posted and may no longer be true or complete when viewed by you. All information may be changed or amended without prior notice.
No representation, warranty or undertaking is given as to the accuracy or completeness of the information by the author and no liability is accepted by the author for the accuracy or completeness of such information. In no event will the author be liable to any person for any direct, indirect, special, or consequential damages arising out of any use of the information, including, without limitation, any lost profits.
You should be aware that the Internet is not a completely reliable transmission medium. The author does not accept any liability for any data transmission errors such as data loss or damage or alteration of any kind, including, but not limited to any direct, indirect or consequential damage, arising out of the use of the product or services referred to herein.
The materials provided here including text, photographs and other images, are protected by copyright and/or other intellectual property rights. All copyright (and any other intellectual property rights) in these materials is either owned by the author, or is used by the author under licence.