


Tape of the Week
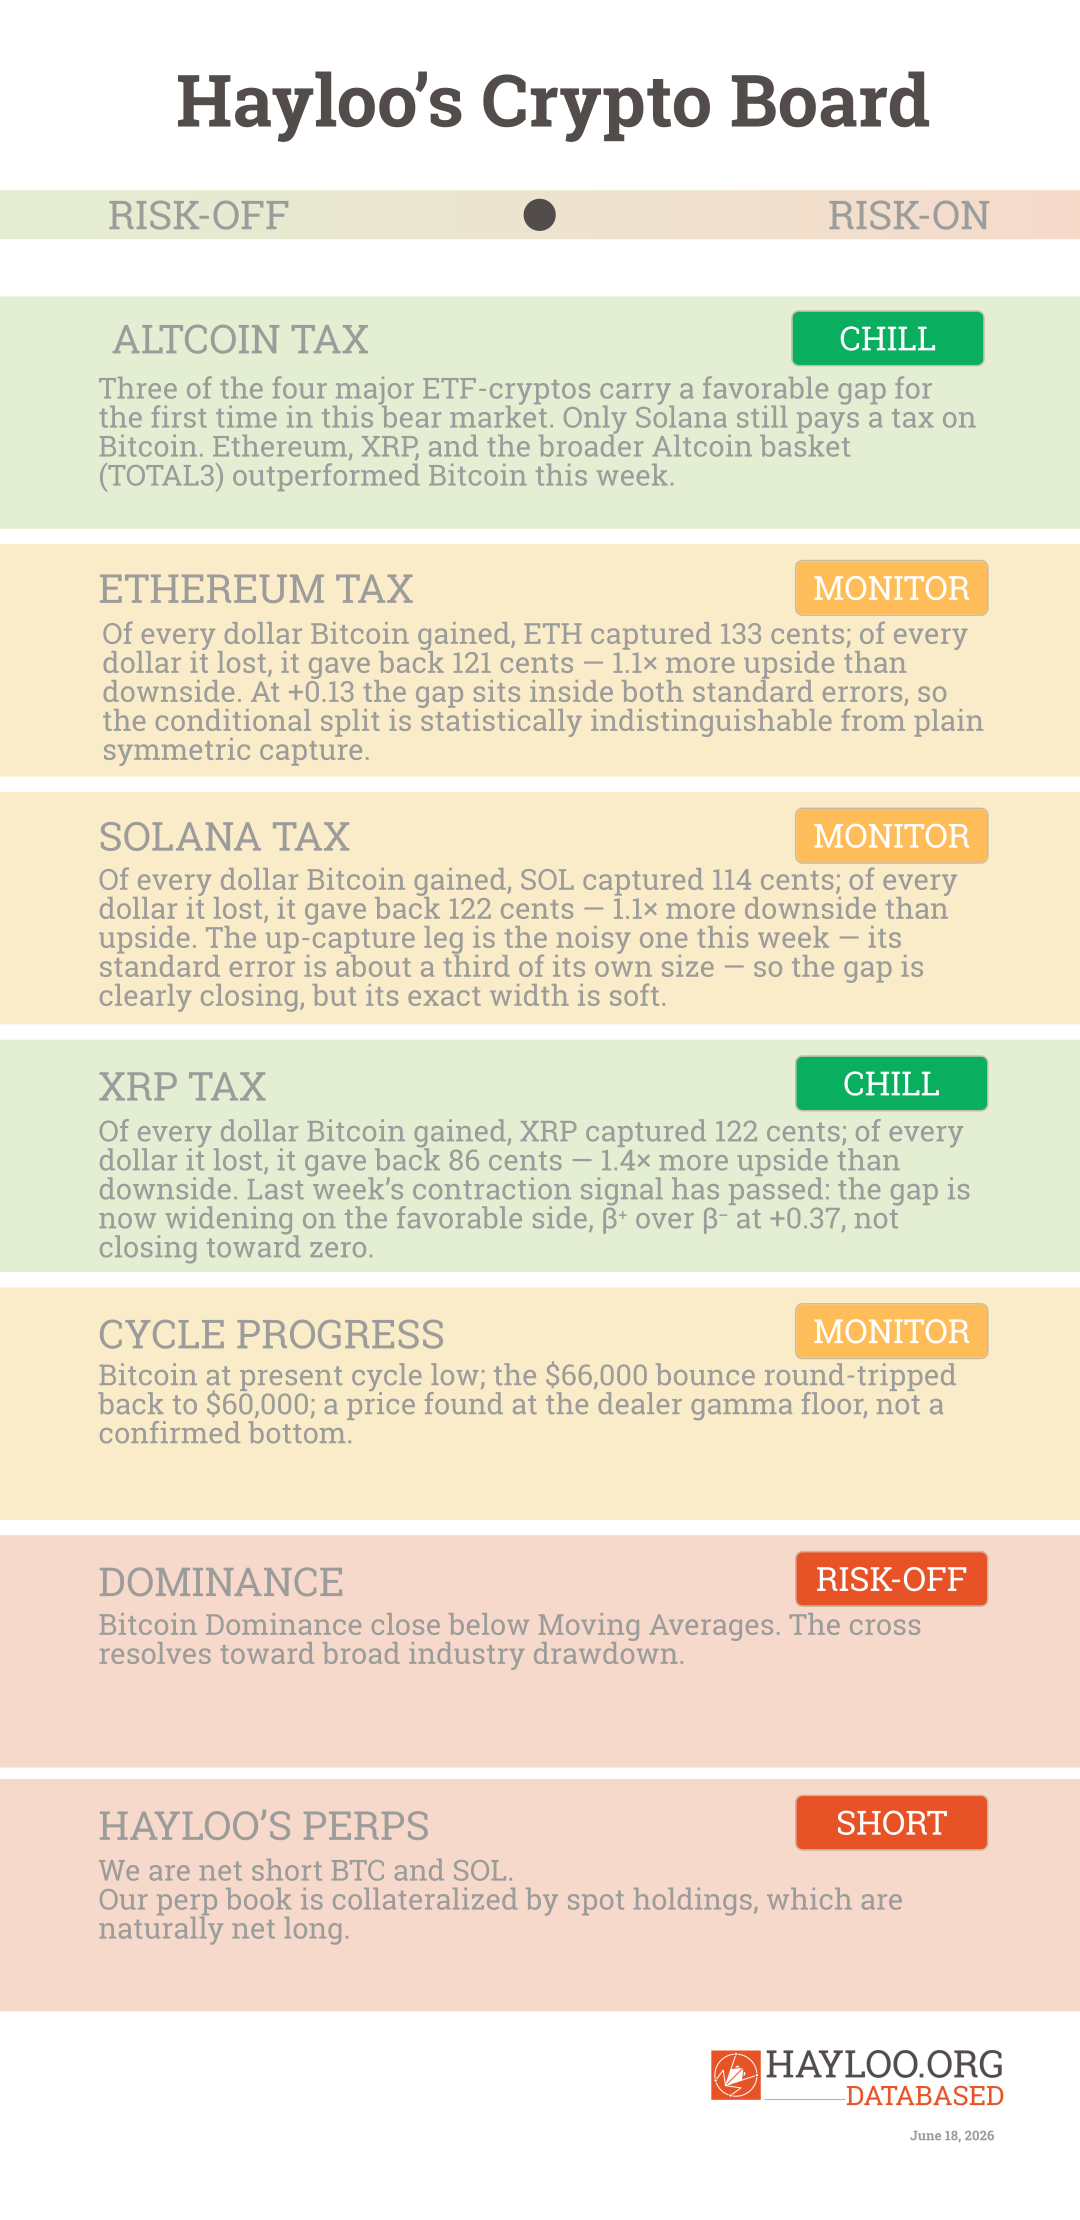
This week, major Altcoins stopped paying the Alt tax. Only Solana, 828 days into the longest Outperform run Hayloo’s Beta Desk tracks, still pays a tax on Bitcoin. Ethereum, XRP, and the broader Altcoin basket (TOTAL3) had more upside than downside on Bitcoin this week.
The dollar broke above its 200-day moving average (MA) for the first time since April. Glassnode’s read of what that means for Bitcoin is blunt: the dollar’s reassertion is the dominant bearish signal on the board, and the recovery so far is an equity story Bitcoin has been left out of.
Bitcoin ran toward $66,000 on the Iran de-escalation early in the week and gave every dollar of it back, sitting inside the dealer long-gamma floor at $60,000 to $64,000. Underneath the price, the stress vector that ran the tape for two months rotated out: West Texas Intermediate (WTI) crude collapsed to a three-month low, dropping the oil price from +27% over a rising long-term average to +1.3% over a flat one, while a global chip selloff put the S&P 500 back below its 20-day Moving Average. The pressure did not leave the markets. It changed address.
The Altcoin Tax
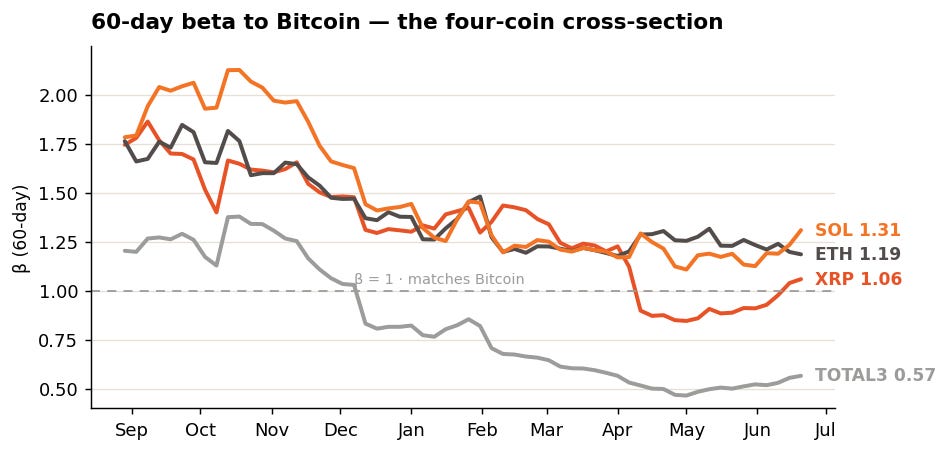
Beta is how much of Bitcoin’s daily move a coin captures. Above 1, it amplifies Bitcoin; below 1, it lags. Split that capture by direction — what a coin grabs on Bitcoin’s up-days (up-capture, β⁺) against what it gives back on the down-days (down-capture, β⁻) — and the gap between the two is the asymmetry. When down-capture runs heavier, a coin is paying a tax on Bitcoin: it over-drops relative to how it rallies. This week, major Alts stopped paying that tax. Only Solana, 828 days into the longest Outperform run Hayloo’s Beta Desk tracks, still pays a tax on Bitcoin. Ethereum, XRP, and the broader Altcoin basket (TOTAL3) outperformed Bitcoin this week.
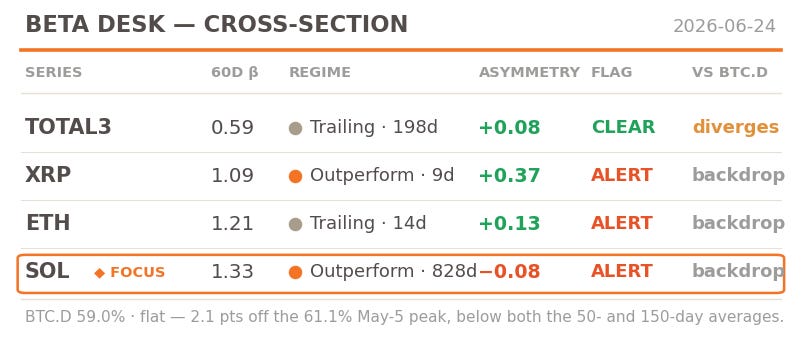
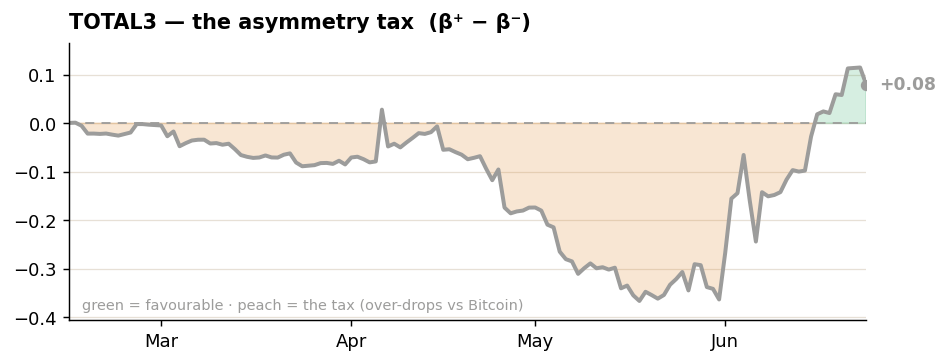
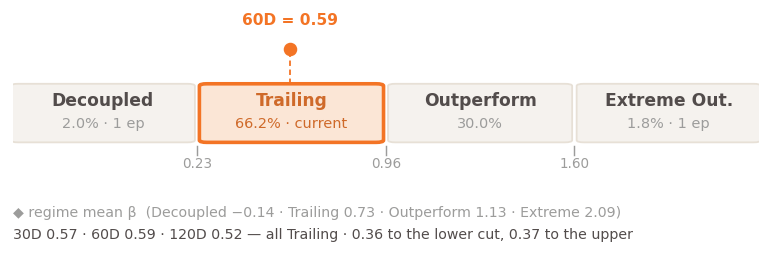
The broad altcoin basket (TOTAL3) sits at a 0.59 sixty-day beta, Trailing for 198 days, gap a favorable +0.08, flag clear — the steady line.
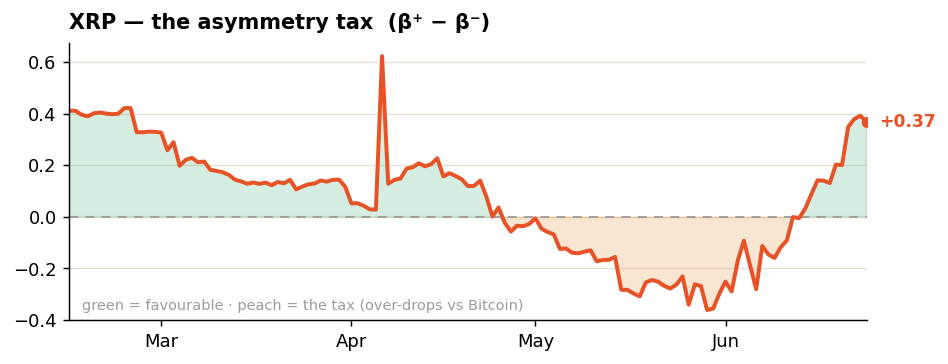
XRP has jumped to 1.09 and into Outperform on its ninth day, gap +0.37, flag firing.
ETH reads 1.21 with a Trailing sixty-day tag but a split across windows, gap +0.13, flag firing.
SOL tops the set at 1.33, Outperform for 828 days, the only negative gap at −0.08, flag firing. Three alerts, one clear.
◆ FOCUS COIN
SOL — 828 days, and the first crack
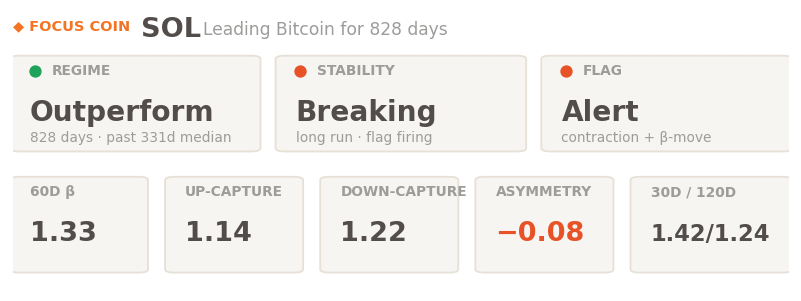
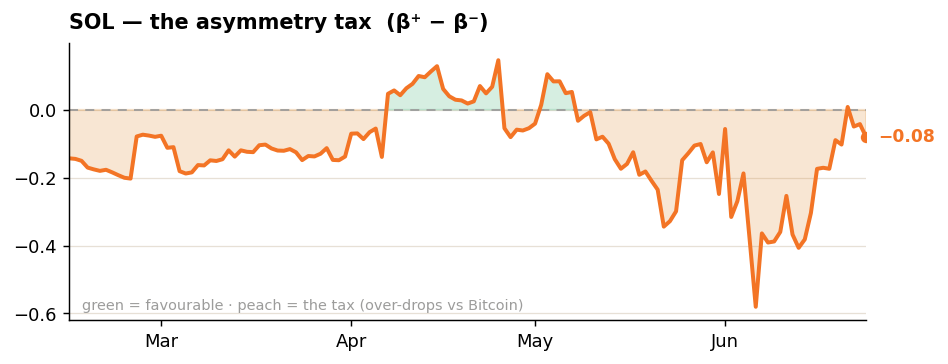
Of every dollar Bitcoin gained, SOL captured 114 cents; of every dollar it lost, it gave back 122 cents — 1.1× more downside than upside. SOL is the only major altcoin still paying the Bitcoin tax. The gap was at its widest at −0.41 on June 13 and snapped to −0.08, tripping the contraction flag, while the sixty-day beta moved 0.20 over 20 days and tripped the fast-move condition alongside it. Honesty note: the up-capture leg is the noisy one this week — its standard error is about a third of its own size — so the gap is clearly closing, but its exact width is soft.
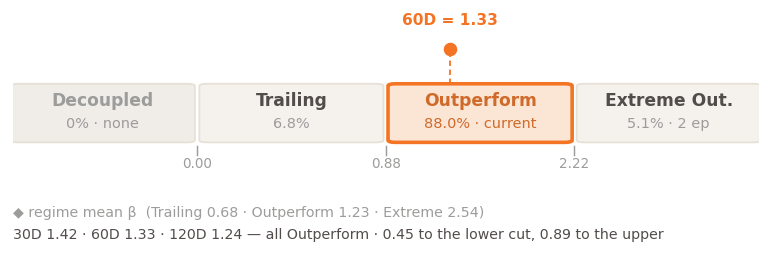
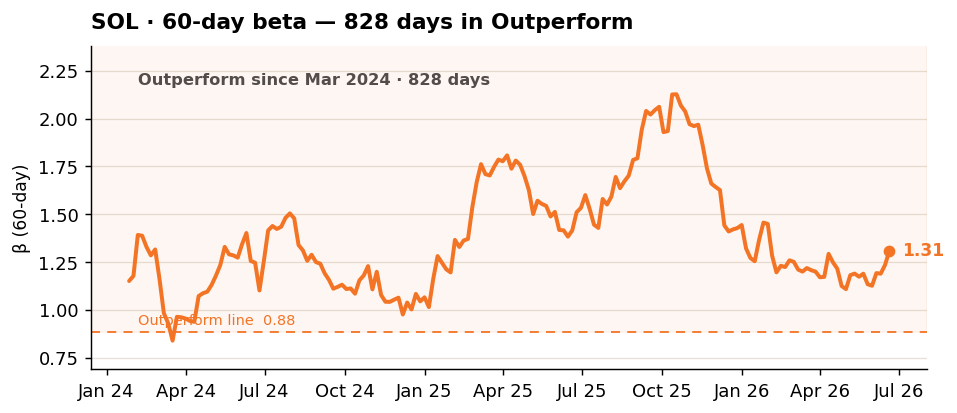
Sixty-day beta 1.33, Outperform for 828 days — the longest run on Hayloo’s Beta desk, and past the 331-day median for this regime by a wide margin.
After more than two years of holding, the asymmetry gap is closing and the beta is repricing fast. The relationship is shifting fast enough now that any read more than about three weeks out is on shaky ground.
🟠 This week’s Solana Tax is on watch.
TOTAL3 — the broad altcoin basket
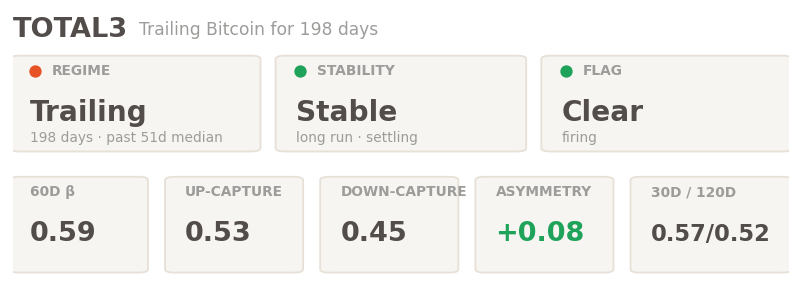
Of every dollar Bitcoin gained, the basket captured 53 cents; of every dollar it lost, it gave back 45 cents — 1.2× more upside than downside. The downside-heavy asymmetry that ran for weeks has flipped, and this is a second straight week of up-capture edging down-capture. The gap held near +0.08, with no contraction and no turn signal. The relationship is steady, and today’s read holds out to the usual horizon.
Sixty-day beta 0.59, Trailing for 198 days — far past the 51-day median run for this regime, and the longest-running, lowest-beta name on the desk.
🟠 This week’s Alt Tax is on watch.
XRP – 1.4 more upside than downside
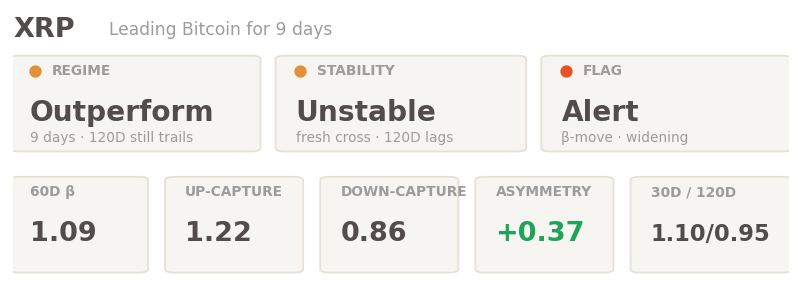
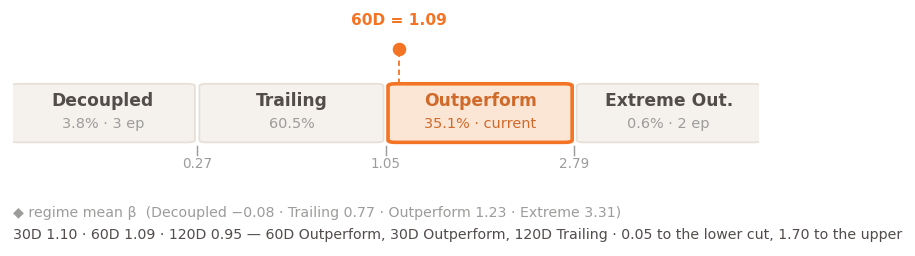
Of every dollar Bitcoin gained, XRP captured 122 cents; of every dollar it lost, it gave back 86 cents — 1.4× more upside than downside, squarely the favorable side. Last week’s contraction signal has passed: the gap is now widening on the favorable side, β⁺ over β⁻ at +0.37, not closing toward zero.
Sixty-day beta 1.09, Outperform on its ninth day. The flag fires on the beta itself: it jumped 0.20 over the trailing 20 days, from 0.89 to 1.09, the fast repricing the backtest flags around turns. The beta sits about 0.05 above its 1.05 Outperform boundary — clear of last week’s knife-edge, but only nine days old.
🟢 This week’s XRP Tax is chill.
ETH – plain symmetric capture
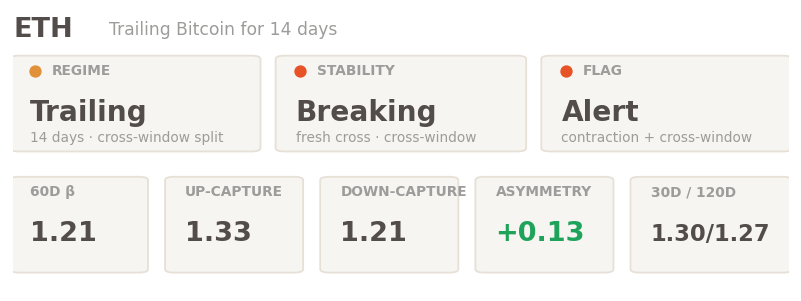
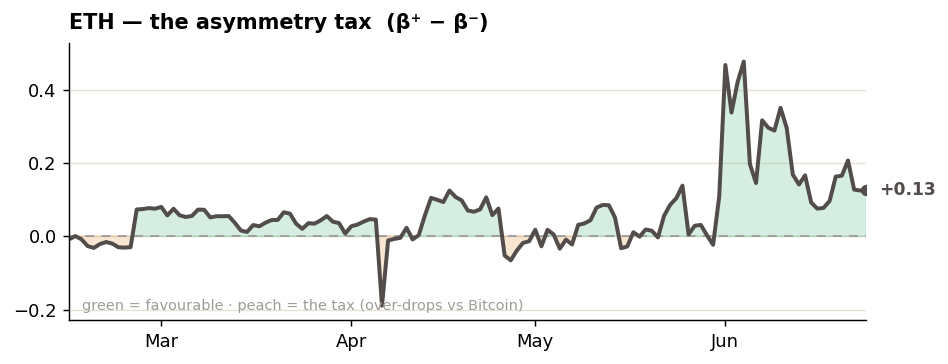
Of every dollar Bitcoin gained, ETH captured 133 cents; of every dollar it lost, it gave back 121 cents — 1.1× more upside than downside. The gap net-contracted from +0.48 to +0.13 over the trailing 20 days, but the path was no clean glide: it spiked in early June, bottomed at +0.08, and bounced. One honesty note: at +0.13 the gap sits inside both standard errors, so the conditional split is statistically indistinguishable from plain symmetric capture this week.
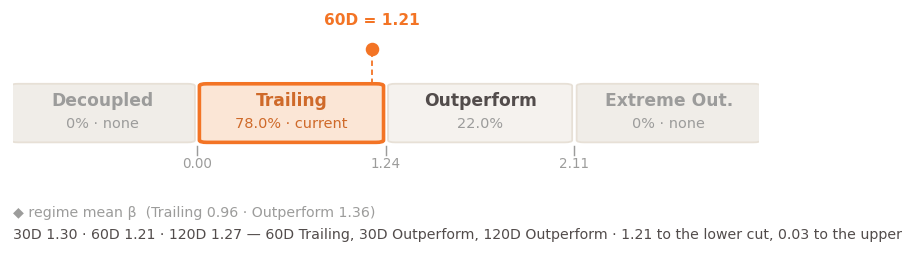
ETH carries only two regimes in its whole history — Trailing and Outperform; no Decoupled, no Extreme.
🟠 This week’s Ethereum Tax is on watch.
On-Chain Tape: The Dollar Is the Whole Story Now
Bitcoin trades at a discount of more than 20% to its True Market Mean (TMM) of 77, 000, a discount that widens as price keeps falling, and the 90 − day average of net realized profit and loss is−205 million a day: the chain is deeply loss-dominant.
But the short-term-holder cost basis declined to $71,400, which means new buyers are accumulating below the mean—a constructive step—and the Coinbase spot Cumulative Volume Delta (CVD) flipped positive, the cleanest tell that the U.S. institutional bid is testing a return to Bitcoin at a discount. That is the single most important crack in the bear, and a reversal of last week’s picture, when Binance carried the bid and Coinbase was absent.
We flag it as exactly that: a flip from Binance to Coinbase, not a reversal.
Binance’s CVD has turned negative; the exchange-traded fund (ETF) bleed runs a sixth week. Derivatives are catching down to spot—open interest spiking, futures CVD turning down, funding easing—the early signature of the violent flush our still net-short book is positioned to harvest.
But dealers are long gamma at $60,000 to $64,000, a near-term floor the flush has to break, and the break is gated on a macro catalyst, not an on-chain one. Glassnode’s conclusion from this week is the one that matters most: the dollar’s reassertion above its 200-day average is the dominant bearish signal for Bitcoin, and the recovery so far is a story Bitcoin has been left out of.
🔴 This week’s on-chain read is early bottoming without confirmation, the dollar the dominant tell against it.
— Capital Flow Analyst (Priya Sandoval) · Fundamental Research Analyst (Charlotte Donovan)
Hayloo’s Perp Book
Size and direction. Hayloo’s perp book remains roughly 201.6 BTC short net (−12.6 million at mark)and 36, 720 SOL short net (−2.6 million at mark), against a BTC reserve that is net-long. The de-escalation bounce that bled the book nearly 13% last week round-tripped, the market did the work.
Next levels that fire. Downside: $55,000 Bitcoin and $55 Solana. The reclaim that reverses any of it is a weekly close above the $77,000 True Market Mean with spot demand attached.
Position vs. thesis. The book is positioned for the bear-continuation read; the flush that does the heavy work is gated on a macro catalyst strong enough to break the dealer long-gamma floor.
— Lead Trader (Jordi Federer)
🔴 Hayloo’s perp book remains net short.
Macro Tape
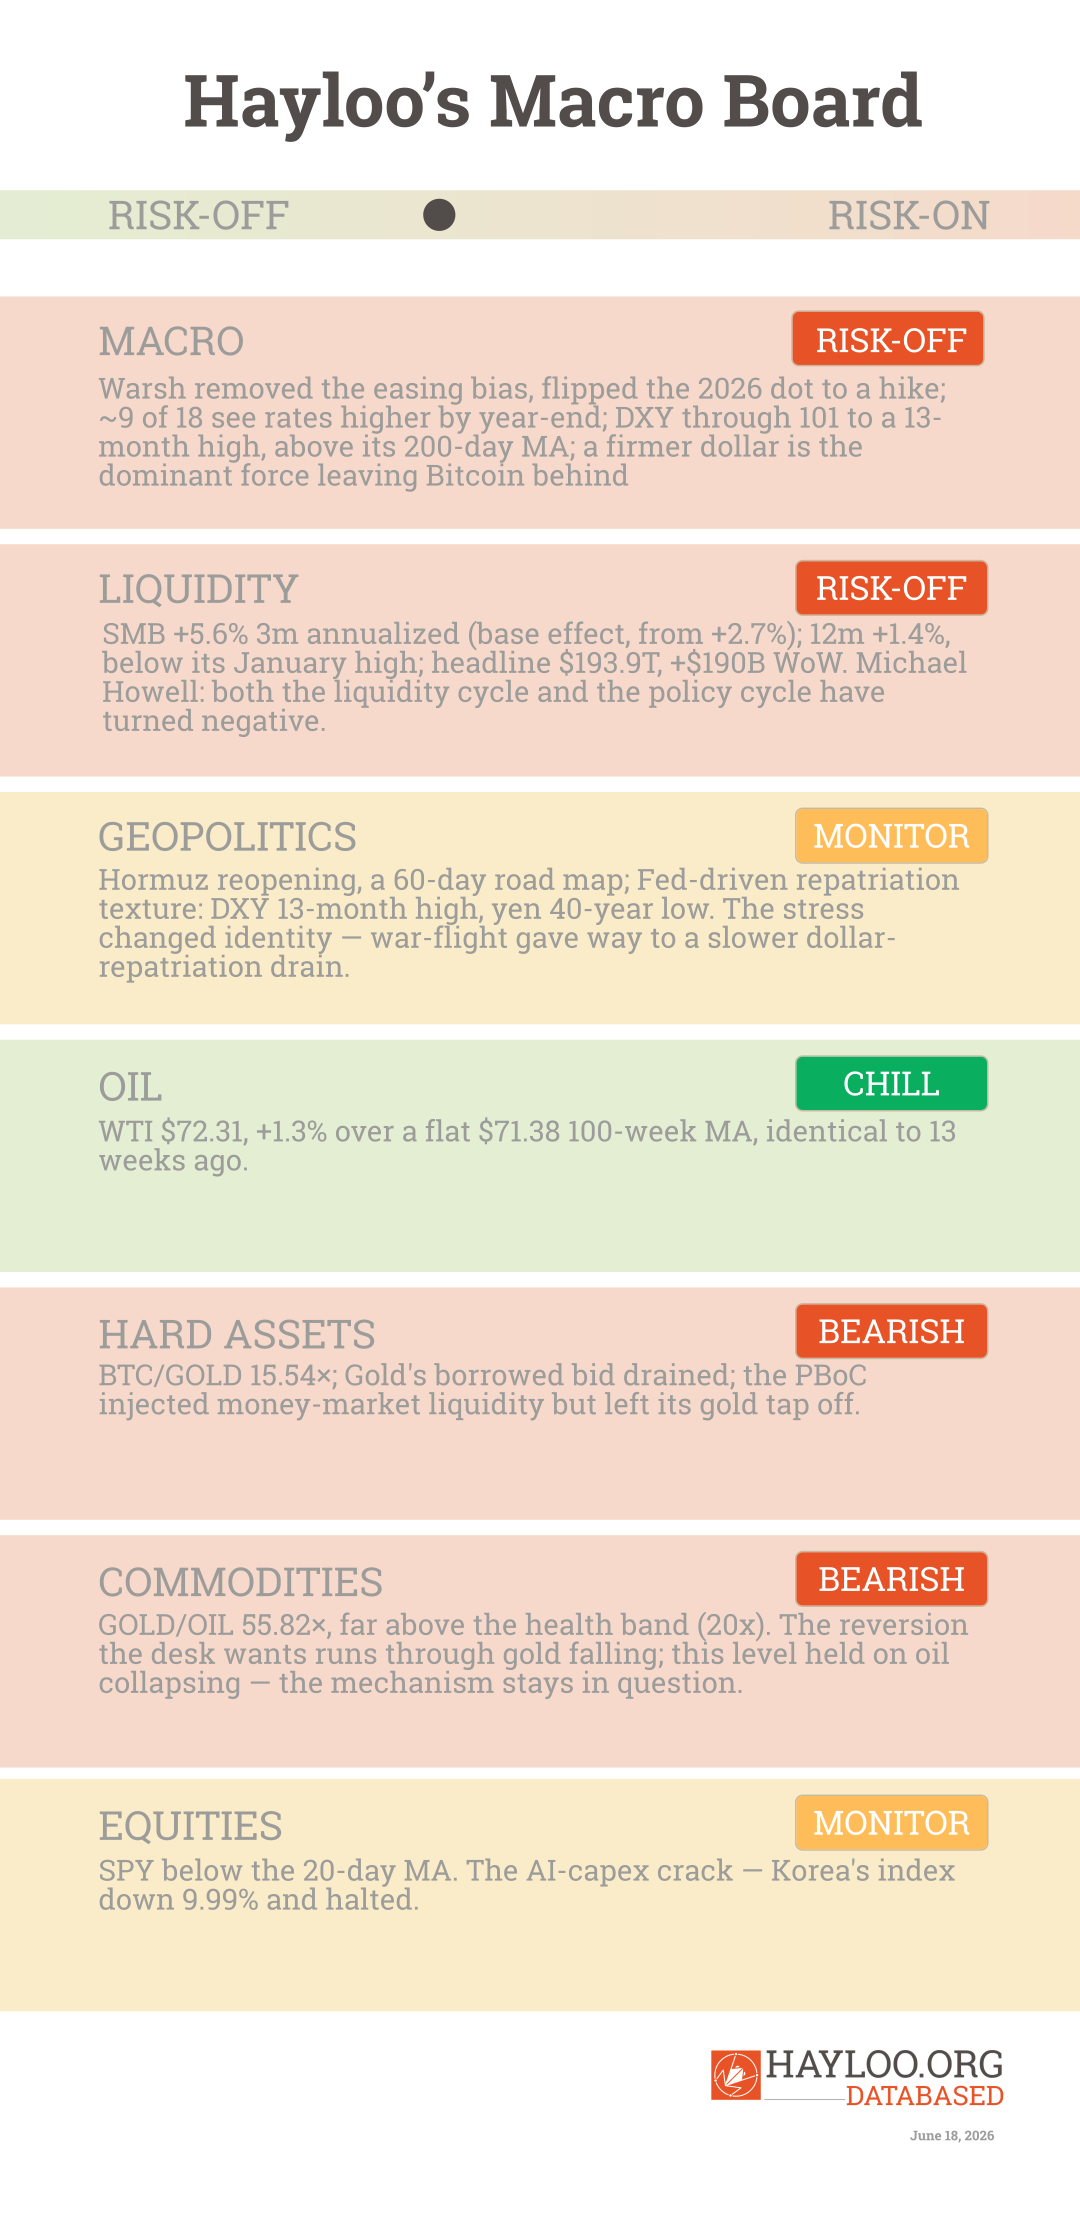
Warsh’s first Federal Open Market Committee (FOMC) meeting removed the easing bias, and the 2026 median flipped from a cut to a hike. The dollar took the message: through 101 to a 13-month high, above its 200-day average for the first time since April, the yen pinned at a 40-year low with Tokyo’s finance minister on the phone to Washington. Underneath, U.S. factory output ran to a four-year high with output prices still climbing—a firm real economy is where the money is going. This is capital coming home to the dollar, not new money entering the system.
🔴 This week’s macro tape remains risk-off; the dollar reassertion is the dominant force on the board.
— Chief Macro Strategist (Theodore Brennan)
Geopolitical Tape
The war the market traded as demand destruction has stood down. After a fortnight of the strait slamming shut and reopening on alternating headlines, the United States and Iran spent a Sunday at a Swiss resort and came out with a 60-day road map; the United Arab Emirates is pumping at roughly 85% of pre-war volume and the shipping regulator has cleared tankers to leave.
🟠 This week’s geopolitical stress stood down on the war and is rebuilding, slower, on the dollar.
— Geopolitical Intelligence Officer (Margaux Lindqvist)
The Commodity Tape
WTI crude fell to a three-month low as the Strait of Hormuz reopened on paper, leaving it +1.3% above its 100-week moving average—and that average is now flat, identical to its level thirteen weeks ago. The supply side has not actually cleared—Iran still says it sets the terms at Hormuz, the tankers run at a discount to China, and the energy-supply surface keeps widening with refinery strikes in Russia—but the market refuses to price any of it.
🟠 This week’s Oil Price refuses to price a complicated supply side.
— Hard Asset Strategist (Marcus Vasquez) · Geopolitical Intelligence Officer (Margaux Lindqvist)
The Equity Tape
The semiconductor trade that held risk-on upright took two real days of damage before steadying—Korea’s index down 9.99% and circuit-broken, the Nikkei off 3%, the U.S. hyperscalers red—and the S&P 500 closed back below its 20-day moving average.
🟠 This week’s equity pillar keeps escalating our marketwide read.
— Capital Flow Analyst (Priya Sandoval) · Chief Macro Strategist (Theodore Brennan)
Hard Assets
BTC/Gold at 15.54× sits well below the 20× early-bull confirmation and a universe from the 40× cycle-peak reference—the two hard-money trades still pulling apart. Gold/Oil held at 55.82×, far above the 15-to-25 health band, and it held there due to oil collapsing and gold holding instead. The dominant signal is still Chinese liquidity-engine deterioration, not a flight to or from real assets.
🔴 This week’s hard-asset ratios remain bearish, and the gold-leads-oil mechanism remains unhealthy.
— Hard Asset Strategist (Marcus Vasquez)
Liquidity Tape
Global liquidity is up $190 billion on the week according to Michael Howell, led by the PBoC net injections. The Shadow Monetary Base three-month rate jumped to +5.6% from +2.7%, the twelve-month rate sits at +1.4% below its January high, and Global Liquidity’s own annual rate slipped to +7.7% from above 8%. The lift in the headline is the volatility-suppression trade—Treasury-bond volatility pinned near its lows—not money creation.
🔴 This week’s liquidity tape points to risk-off.
— Global Liquidity Director (Julian Harlow)
Forward Thesis
The next four to twelve weeks read lower-to-choppy, with the deepest price-headwind window in late August— May’s Shadow Monetary Base trough plus roughly thirteen-week transmission lag. The stress vector rotated from a geopolitical premium that is now spent to an AI-capex equity crack that is just beginning; the dollar’s reassertion is the dominant force leaving Bitcoin behind. The structural long thesis for 2029 to 2030 is intact; this is a tactical short for the contraction.
One reflexive risk stays on the board and is worth its own line. Strategy’s funding loop is straining: STRC closed at $87.31, still $12.69 below the par it was sold at, with the company roughly 17% underwater on its Bitcoin stack and buying on common stock for a third straight week because the preferred door is shut. The runway is roughly seven and a half months. The loop has not broken; it is straining. It resolves the day STRC returns to par or the loop snaps.
What would change our mind, each against its current value:
Shadow Monetary Base (SMB) turning clearly positive and non-base-effect, with the twelve-month rate rising at the same time. It is +5.6% on the three-month read, but PBoC-driven and the twelve-month rate is falling.
The Realized Profit/Loss Ratio (RPLR) holding above 2.0 across multiple weeks. It is −0.6.
A clean weekly close above $77,000 with Binance’s bid joining Coinbase’s. Coinbase flipped positive this week; Binance went the other way.
ETF inflows of 1.5 billion a week for two consecutive weeks. – Flows are bleeding.
Ten consecutive S&P 500 closes below the 20-day average—the escalate side. The counter is at 2/10 on a fresh streak; this one fires toward action before it fails toward comfort.
The repatriation flow flipping to genuine net-new global liquidity—U.S. inflows persisting and broadening while Howell’s liquidity turns back up, simultaneously. His twelve-month measures are falling; the two do not co-occur.
If two of these appear at once, we re-evaluate the book on the next weekly. Today none is close, and the one partial crack we flag—Coinbase’s bid returning—is one venue, not a regime.
Watchlist
BTC at $77,000—True Market Mean
BTC at $53,400—Realized Price
The S&P 500 20-day Moving Average—The test of whether the chip leg keeps bleeding.
Bitcoin Funding Rates—the +2.79% income in Hayloo’s book decaying.
ETF flow magnitude and breadth—the Grayscale-led persistent outflow against the Coinbase-CVD-flip contra-tell; Binance joining the bid is the breadth condition, and two weeks of $1.5 billion-plus net inflows forces re-evaluation.
Howell’s SMB next print and the MOVE index—a clearly-positive, non-base-effect SMB with the twelve-month rate rising would be the first real engine crack; a MOVE re-spike above 80 reverses the volatility-suppression lift carrying the headline liquidity number.
GOLD/OIL—contracting toward 20 or expanding beyond 50?
STRC and Strategy—the reflexive loop straining at $12.69 below par; a par reclaim or a loop break.
BTC.D—dominance below the 100-week moving average, needing directional input.
The Hayloo Unchained Team
Chief Macro Strategist—Theodore Brennan. Macroeconomic cycles, central bank policy, growth and recession dynamics, sovereign debt, currency regimes. Flags regime shifts as they materialize.
Geopolitical Intelligence Officer—Margaux Lindqvist. Geopolitical risk, capital flow implications of conflict and alliance shifts, sanctions, resource competition, regime stability. Maps geopolitical events to capital flow implications.
Hard Asset Strategist—Marcus Vasquez. Responsible for identifying dollar-devaluation mispricing. Surfaces gold-denominated reads when the dollar regime shows signs of inflection.
Inflation & Real Asset Analyst—Sienna Whitfield. Assets priced against inflation. CPI, PPI, breakevens, real yields, commodity structures. Flags when nominal gains are real losses. Ensures harvest decisions are evaluated against real returns, not nominal.
Global Liquidity Director—Julian Harlow. Liquidity cycles, central bank balance sheets, cross-border credit creation. Anchors the team’s months-to-years time horizon.
Capital Flow Analyst—Priya Sandoval. Cross-asset flows, fund positioning, ETF mechanics, derivatives positioning, futures term structure. Tracks where new liquidity routes, surfaces flow shifts that contradict the standing synthesis.
Technical Analyst—Lukas Marchetti. Price action, structure, and pattern—calibrated to match the liquidity cycle timeframe. Technicals are treated as lagging confirmation of forward-looking signals. Divergence between technicals and macro thesis is expected and discussed, not resolved by hierarchy.
Fundamental Research Analyst—Charlotte Donovan. Asset-level fundamentals, network economics, supply dynamics, miner behavior, adoption curves. Tracks supply-side dynamics—LTH/STH cohorts, miner state, on-chain cost-basis structure.
Lead Trader—Jordi Federer. Domain: the book itself—capital allocation across perp positions and the spot collateral reserve; entry, harvest, and restructure calls; risk tolerance and conviction-sizing at execution. Hayloo is unchained by him.
The information is provided for information purposes only and on the basis that it will not be relied upon. No information contained herein constitutes a personal recommendation or investment advice.
The information (including any expressions of opinion or forecast) has been obtained from, or is based on, sources believed by the author to be reliable, but are not guaranteed as to their accuracy or completeness and should not be relied upon. The information is provided without obligation on the part of the author and on the understanding that any person who acts upon it or changes his investment position in reliance on it does so entirely at his own risk. The information does not constitute an offer to buy or sell or an invitation to make an offer to buy or sell any financial instrument.
Information is current only as at the date it is first posted and may no longer be true or complete when viewed by you. All information may be changed or amended without prior notice.
No representation, warranty or undertaking is given as to the accuracy or completeness of the information by the author and no liability is accepted by the author for the accuracy or completeness of such information. In no event will the author be liable to any person for any direct, indirect, special, or consequential damages arising out of any use of the information, including, without limitation, any lost profits.
You should be aware that the Internet is not a completely reliable transmission medium. The author does not accept any liability for any data transmission errors such as data loss or damage or alteration of any kind, including, but not limited to any direct, indirect or consequential damage, arising out of the use of the product or services referred to herein.
The materials provided here including text, photographs and other images, are protected by copyright and/or other intellectual property rights. All copyright (and any other intellectual property rights) in these materials is either owned by the author, or is used by the author under licence.