


Hayloo Unchained Trading Team — May 27, 2026
Contributors this week: Lead Trader, Chief Macro Strategist, Global Liquidity Director, Geopolitical Intelligence Officer, Hard Asset Strategist, Capital Flow Analyst, Fundamental Research Analyst.
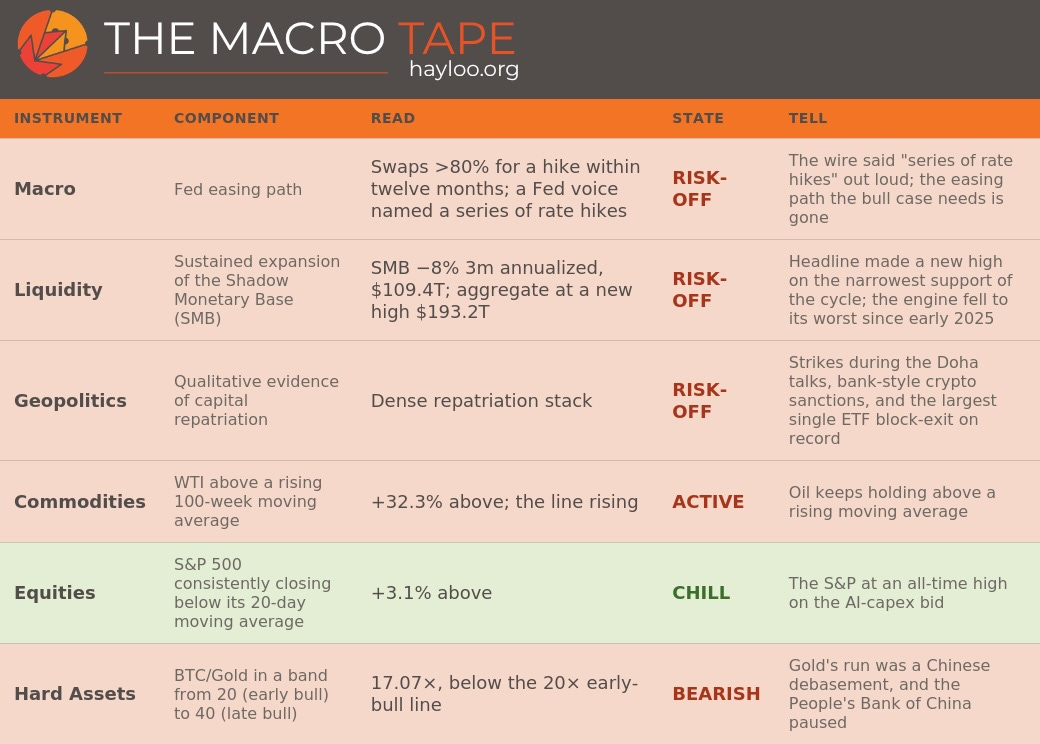
Hayloo’s Macro Board
TL/DR
The rally died at the threshold a second time. Bitcoin failed at the True Market Mean (TMM), the loss-realization ratio stepped down rather than up, and both demand-side reads moved further from the levels that mark a genuine bull-market expansion.
Michael Howell’s aggregate Global Liquidity broke a new high at $193.2 trillion on three-month annualized growth of 8.7%, the strongest momentum of the year, while the Shadow Monetary Base — the granular slice that leads risk assets — fell to $109.4 trillion, three-month annualized circa −8%, the weakest since early 2025. The transmission lands in late August.
The exchange-traded fund (ETF) bid reversed hard. US spot Bitcoin ETFs logged a seventh consecutive day of outflows, with week-to-date redemptions of $1.89 billion and a single investor walking $1.289 billion out of one fund in a dark-pool trade described as the largest of its kind ever seen.
The macro wire turned explicit. A Federal Reserve voice named a series of rate hikes — the first plural-hikes framing of the cycle — the European Central Bank (ECB) was pushed toward a June hike, and swap markets priced better than 80% odds of a hike within twelve months. The bull case’s one requirement, an easing path, is gone.
Hard assets are pulling apart rather than confirming each other. BTC/Gold at 17.07× sits below the 20× early-bull line and Gold/Oil widened to 47.62×, away from the long-run mean rather than toward it. The path to that mean now runs through gold falling, not oil rising: the People’s Bank of China (PBoC) has paused and the yuan-side gold mechanism is removed.
The book paid again. Wallet equity reached 9, 202, 811, up4.653,358 annualized.
Forward thesis: contraction from current 75K–77K consolidation toward $71,400 and then $66,000, through the late-August transmission window. The book stays net short.
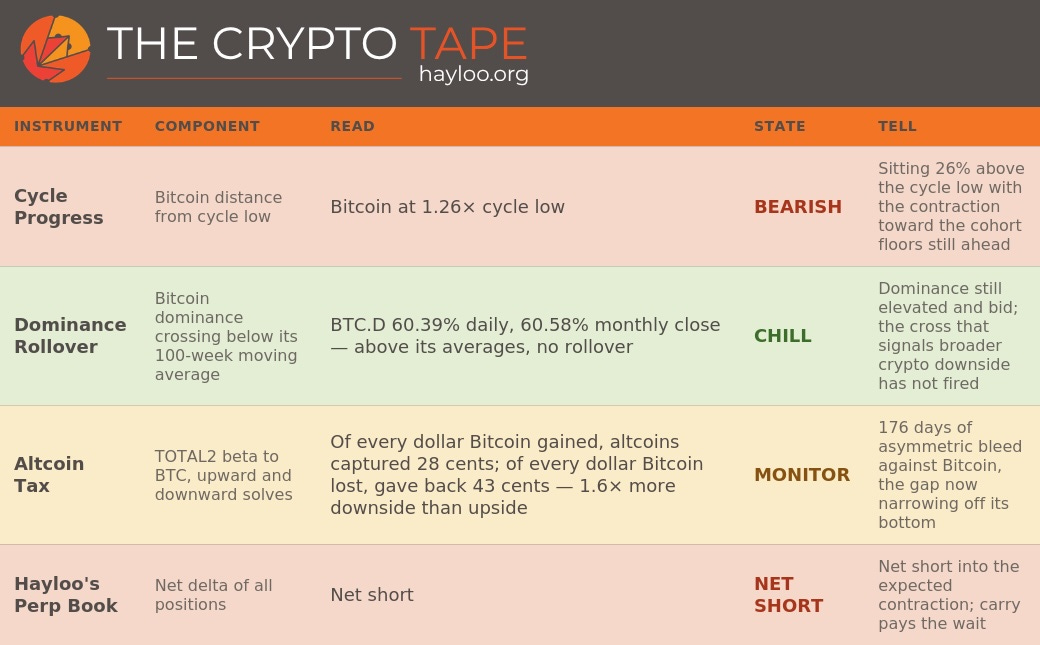
Hayloo’s Crypto Board
Tape of the Week
Three desks read this week three different ways and arrived at one picture: capital is being added at the surface and pulled out underneath, and the gap between the two is wider than it was last week.
Start with liquidity. Aggregate Global Liquidity broke a new high at $193.2 trillion on three-month annualized growth of 8.7%, the strongest momentum of the year. One layer down, the Shadow Monetary Base — the granular slice that leads risk assets — fell another step to $109.4 trillion, three-month annualized circa −8%, the weakest reading since early 2025. The headline is held up by Federal Reserve liquidity and a Treasury-suppressed bond-volatility regime; the engine is held down by a stronger dollar everywhere except the yuan and tightening liquidity out of the People’s Bank of China. The two measurements are telling opposite stories, and the one that leads is the one falling.
Glassnode is structurally identical on-chain. Bitcoin failed at the True Market Mean near $78,300 a second time, the Short-Term Holder (STH) cost basis near $78,000 has converged into that overhead band, and the late-April buyers who accumulated into 75, 000–78,000 sit on a thin margin in a top-heavy structure. Glassnode’s own framing is that any demand shortfall or external shock risks a sharp contraction, because this cohort is among the first to react to a downside break.
The macro wire turned explicit in the same week. A Federal Reserve voice named a series of rate hikes — the first plural-hikes framing of the cycle — the European Central Bank was pushed toward a June hike, and a single investor walked $1.289 billion out of BlackRock’s spot Bitcoin exchange-traded fund in a dark-pool trade described as the largest of its kind ever seen. It was the seventh consecutive day of US spot Bitcoin ETF outflows. The direction across all three desks is the same, and the book stays net short into the late-August transmission window.
Geopolitical Tape
Iran–US permanence across every camera: no Hormuz agreement, Hormuz named as the enforcement mechanism, the Islamic Revolutionary Guard Corps Navy claiming it permitted ship passage under its own coordination, and US Central Command correcting a press report that convoy operations had resumed
US overnight strikes on Iranian missile launch sites while Iranian negotiators were in Doha, on May 26
UK Regulation 17A bank-style sanctions applied to the crypto exchange HTX and 17 other crypto entities for Russia sanctions-evasion — the first time correspondent-bank-equivalent treatment has been applied to a crypto exchange
Russia’s Oreshnik intermediate-range ballistic missile on Kyiv overnight, and magnetic mines on tankers at a Russian Baltic oil terminal
The US 30-year Treasury at 5.18%, a post-2007 high, with the secured overnight financing rate (SOFR) less Fed-funds spread negative, last seen late 2021
The ECB’s Financial Stability Review warning of “sudden and significant correction” risk and naming leveraged-hedge-fund concentration in bond markets
A $1.289 billion exit from BlackRock’s IBIT in a single dark-pool trade
This is a dense capital-flow repatriation stack; the regulator that usually absorbs the shock is now flagging it.
🔴 This week’s institutional capital flows are RISK-OFF.
The Commodity Tape
Oil Price — WTI sustained above its 100-week moving average, and that average rising over a quarterly window.
Live: WTI $93 versus 100-week moving average $70.31 (sustained above ✓); 100-week moving average 13 weeks ago $69.163, current $70.31, trajectory +1.66% (rising ✓). WTI sits +32.3% above the line.
The Iran arc widened on every axis this week and WTI still held near $93 rather than breaking out. When the risk-off from a widening Middle East conflict expresses itself in a crypto test of $75,000 and a bid under bonds instead of an oil spike, it tells us where the fragile positioning actually sits.
🔴 This week’s oil tape is BEARISH.
The Equity Tape
Equities — SPY 10 or more consecutive daily closes below its 20-day moving average.
Live: SPY $751 versus 20-day moving average $728.22, +3.1% above.
The S&P 500 is at an all-time high, the Nasdaq 100 broke 30,000 for the first time, and the AI-capex bid is underwriting both. That bid is the only thing keeping the third severe-stress pillar at zero, even with the macro substrate the way it is — the 10-year above the 4.5% threshold past which equities have historically underperformed, and the equity risk premium at its lowest since 2007. Two of three pillars have been active for a sixth consecutive week. A correction of the AI-capex bid is the proximate path, and that fragility is the dominant tail-risk this cycle.
🟢 This week’s equity pillar is CHILL.
— Geopolitical Intelligence Officer (Margaux Lindqvist) · Chief Macro Strategist (Theodore Brennan)
Hard Assets
Gold’s quiet this week is doing more work than its price. It sits near $4,429, and the two hard-money trades are pulling apart rather than confirming each other. The mechanical reads on the two ratios:
BTC/Gold ratio at $75,623 / $4,429 = 17.07×. Below the 20× early-bull confirmation line, and a universe from the 40× exit territory our calibration watches. Bitcoin is losing ground against gold, not gaining it.
🔴 This week’s BTC/Gold ratio is in BEAR-MARKET territory.
Gold/Oil ratio at $4,429 / $93 = 47.62×. Up from 42.9× on May 20 — the ratio expanded as oil fell faster than gold, moving away from the long-run mean of about 20× rather than toward it.
The compression toward that ~20× mean still holds as a destination, but the path now runs through gold falling, not oil rising. The PBoC has paused, the yuan-side gold mechanism is removed, and gold faces further headwinds from tightening PBoC liquidity. Yesterday’s record-low policy-rate cut did not show up in the daily injection data, did not transmit to the Shanghai Composite, and did not transmit to yuan-gold. The debasement bid that supported both gold and Bitcoin is fading.
🔴 This week’s Gold/Oil ratio is in INFLATION territory.
— Hard Asset Strategist (Marcus Vasquez)
Position Tape
Size and direction. We carry $9,202,811 in wallet equity today, up 4.6% on the week. The book is net short on the perp leg.
Nothing was added, and that is the point. We have not changed exposure since the May 22 restructure and the May 25 take-profit cascade. The week’s 4.6% is mark-to-market on the existing net-short book as the legs paid on every downside print — not new risk taken on.
Funding rate carry. Running positive at +$53,358 annualized, +0.58% of equity in income — the fifth consecutive print in income territory.
Next levels that fire. On the downside: $71,400 (the cohort cost basis, −5.6% from spot) is the first contraction target and the first Long Add evaluation; $66,000 (BTC Long Add L1, −12.7%) activates if $71,400 breaks. On Solana: $82 (Long Add L1, −2.2%) is the closest live trigger on either leg, with $90 (Short Add S1, +7.4%) above. The $75,000 dealer-gamma cluster (−0.8%) is the near-term amplification mechanic into Friday’s monthly expiry. Overhead, the band that has to be reclaimed before any of this reverses: roughly $80,000 (the prior rejection band) and the True Market Mean.
Position vs. thesis. The book is built for the contraction read. If it fails — the SMB clearly positive, the loss-realization ratio sustained above 2.0, a weekly close above $80,000 with Coinbase joining the bid, ETF inflows back to $1.5 billion-plus, or the equity pillar firing — the position re-evaluates against the five named conditions in the Forward Thesis below.
🔴 This week’s position tape is NET SHORT.
— Lead Trader (Jordi Federer)
Liquidity Tape
Aggregate Global Liquidity edged to a new high at $193.2 trillion, with three-month annualized growth at a strong 8.7% and annual growth at 7.5%. Read one layer below and the picture inverts, as it has for a month. Headline liquidity made a new high while Bitcoin tested $75,000. That gap is the story.
The expansion is narrowly driven — Federal Reserve liquidity plus a suppressed bond-volatility regime lifting collateral values. The MOVE Index, the measure of Treasury-bond implied volatility (IV), sits near 80, down from a spike to 86 a week ago, but still close to maximum pain for the US Treasury.
The SMB fell to $109.4 trillion, three-month annualized circa −8%, down from −6.3% the prior print — a roughly ten-percentage-point swing across two weekly reads, and the weakest since early 2025.
The implication is uncomfortable for anyone reading the current consolidation as a floor. The headline can hold for a while on Fed and Treasury support, but the engine that leads risk assets is contracting hard, and when its signal transmits on schedule it arrives as a fresh source of pressure on a market already testing its cohort floors. We are further from a bull market than we were two weeks ago.
🔴 This week’s liquidity tape points in the direction of RISK-OFF.
— Global Liquidity Director (Julian Harlow)
On-Chain Tape
Glassnode titled the week Stalling at the Threshold, and the structural event is the one that matters most: Bitcoin failed at the True Market Mean near $78,300 for a second time, and the Short-Term Holder cost basis near $78,000 has converged into that same overhead band. New buyers clustered at the market’s key mean valuation, sitting on a thin margin into a top-heavy structure, are the cohort that reacts first to a downside break.
The capital-flow reads underneath it stepped the wrong way. The Realized Profit and Loss Ratio (RPLR) 30-day moving average stepped down to 1.56 from 1.8, against the 2.0-to-5.0 band Glassnode names as the historical regime for genuine bull-market expansion — the directional improvement that defined April and early May reversing without ever crossing the threshold. The STH net realized profit-and-loss normalized by realized cap, Glassnode’s named capital-flow magnitude gauge, has faded back to −0.02%, near-neutral, after recovering from −0.44% in February to briefly positive at the late-April peak. Sufficient to confirm direction; insufficient on magnitude. Spot order flow has rolled back into net sell-side dominance over two weeks, and the constructive Coinbase signal of two weeks ago has lost its legs.
Off-chain, the ETF bid reversed. US spot Bitcoin ETFs are in a seventh consecutive day of outflows, with week-to-date redemptions of $1.89 billion, a two-week cumulative of $2.26 billion, and a CoinShares weekly print of $1.47 billion — the third-largest single week of 2026. A single investor walked $1.289 billion out of BlackRock’s IBIT in one dark-pool trade.
Derivatives are compressing into the event. One-month implied volatility has fallen to about 33% from 38.5% over two weeks, 30-day realized volatility sits at 27%, and the volatility risk premium has widened to roughly ten points, the highest in recent weeks. The operational layer is dealer gamma: the dominant negative cluster sits at $75,000 with more than $8 billion of exposure into Friday’s May monthly expiry, significantly larger than the $2.5 billion noted last week. Until the roll passes, dealer hedging amplifies any move through $75,000; once it passes, the gamma landscape clears and the structure recomposes. Glassnode’s conclusion is the one we share: the market remains vulnerable to further downside until spot demand strengthens and selling subsides.
🔴 This week’s on-chain metrics remain BEARISH.
— Capital Flow Analyst (Priya Sandoval) · Fundamental Research Analyst (Charlotte Donovan)
Macro Tape
The week’s contradiction is now on the wire. The S&P 500 is at an all-time high, the Nasdaq 100 broke 30,000 for the first time, the KOSPI has run from roughly 5,000 to 8,300 year-to-date, and Goldman raised its year-end S&P target to 8,000 — at the same tape where gold is breaking $4,500, Bitcoin is testing $75,000, the US 30-year touched 5.18% (a post-2007 high), the 10-year is above the 4.5% threshold past which equities have historically underperformed, and the equity risk premium sits at its lowest since 2007. The financial press is naming the gap rather than smoothing it.
🔴 This week’s macro tape points in the direction of a RISK-OFF regime.
— Chief Macro Strategist (Theodore Brennan)
Forward Thesis
We expect Bitcoin to contract from the current 75K–77K consolidation toward the February–April cohort cost basis at $71,400 — Glassnode’s named most-probable near-term support — and, if that level breaks, toward the BTC Long Add L1 at $66,000. The rejection at the True Market Mean has been confirmed structurally rather than weakened: the loss-realization ratio moved further from satisfaction this week, not closer.
The $75,000 dealer-gamma cluster is the amplification mechanic between current spot and the $71,400 floor. With more than $8 billion of negative gamma into Friday’s May monthly expiry, hedging flows amplify any downside move through $75,000 — and then disappear after the roll. The read is path-conditional: if the move comes before the expiry, dealer hedging accelerates it; if the level holds through the roll, the gamma landscape clears and the structure recomposes. The 13-week transmission lag from this week’s circa −8% SMB reading points to late August 2026 as the deepest price-headwind window. We expect choppy decay through June and July as the engine’s collapse transmits, with the most acute test in the August window. The book stays net short into both branches; carry pays the wait.
What would change our mind. Five conditions, any one of which triggers a Position Tape re-evaluation at the next weekly run:
SMB three-month annualized clearly positive on the next print. It is circa −8% now — the most demanding single condition, given the roughly ten-percentage-point swing across the last two prints.
The loss-realization ratio sustained above 2.0 across multiple weeks. It stepped down to 1.56 this week, further from satisfaction than it was.
A Bitcoin weekly close above $80,000 with sustained spot demand, including Coinbase joining the bid — not a wick, not a derivatives squeeze. Coinbase order flow is still subdued.
**ETF inflows back to 1.5billion − plusweeklynet, sustainedfortwoconsecutiveweeks. * * Weareintheoppositeregime : week − to − date−1.89 billion across a seven-day outflow streak.
The severe-stress equity pillar firing — the S&P 500 closing below its 20-day moving average ten times in a row. The counter is at 0/10, held there by the AI-capex bid. This is the one condition that would escalate the read rather than relax it, and the only one within mechanical reach of firing in days rather than weeks.
The asymmetry to flag is in that last one. The S&P at an all-time high keeps the equity pillar alive, but the bond-yield substrate, the equity risk premium math, the named-correction ECB warning, and the institutional dark-pool exit all load the same direction as everything else this week. A correction of the AI-capex bid is the proximate path from convergence-not-firing to convergence-firing.
— Lead Trader (Jordi Federer)
Watchlist
BTC at $76,900 — the 1-month-to-1-week cohort floor, lost five times in nine sessions. Break-and-hold below opens the contraction toward $71,400.
BTC at $75,000 — the dealer-gamma negative cluster, more than $8 billion of exposure into Friday’s monthly expiry. Mechanical amplification of downside through this level until the roll.
BTC at $71,400 — the February–April cohort cost basis. The first Long Add L1 evaluation lands here on contact through the $75,000 cluster.
BTC at $66,000 — BTC Long Add L1, −12.7% from spot. Activates if $71,400 breaks.
SOL at $82 — SOL Long Add L1, −2.2% from spot. The closest live trigger on either leg.
SOL at $90 — SOL Short Add S1, +7.4% from spot. Activates if Solana bounces.
SMB three-month annualized, next print — currently circa −8%. A positive print resets the macro read materially; the late-August transmission window is the structural watch.
MOVE Index — circa 80 per Howell, Treasury-suppressed. Sustained above 80 reverses the multiplier expansion carrying the headline liquidity number.
PBoC daily liquidity injections — the slump persists; yesterday’s record-low policy-rate cut did not transmit.
ETF flow magnitude and breadth — week-to-date −$1.89 billion across a seven-day outflow streak. Net weekly inflows above $1.5 billion sustained two weeks force re-evaluation; Coinbase order flow joining the bid is the contra-thesis confirmation.
Coinbase versus Binance order flow — Coinbase subdued against a modestly recovered Binance. A Coinbase-led bid is the tape-confirmation signal.
30-year US Treasury yield — 5.18%, a post-2007 high, with the SOFR-less-Fed-funds spread negative, last fired late 2021.
SPY versus its 20-day moving average — +3.1% above, counter 0/10. A roll below the average starts the cascade out on the risk curve, into Bitcoin and the rest of crypto.
Loss-realization ratio (RPLR) 30-day moving average — 1.56 today, stepped down from 1.8. The 2.0 threshold marks genuine buy-side recovery.
BTC May 29 Deribit monthly expiry — roughly $6.6 billion of open interest, with call concentration at $80,000 and put concentration at $75,000. Friday’s gamma roll.
Personal Consumption Expenditures (PCE), Friday May 30 — Cleveland Fed nowcaster headline 3.8% against Howell’s annualized 8.3%. A wide spread.
The Hayloo Unchained Team
Chief Macro Strategist — Theodore Brennan. Macroeconomic cycles, central bank policy, growth and recession dynamics, sovereign debt, currency regimes. Anchors daily and weekly reads to the current macro regime. Flags regime shifts as they materialize.
Geopolitical Intelligence Officer — Margaux Lindqvist. Geopolitical risk, capital flow implications of conflict and alliance shifts, sanctions, resource competition, regime stability. Integrates the daily news brief into the daily synthesis. Maps geopolitical events to severe-stress convergence components and to capital flow implications. Surfaces brief-content tensions with the Standing Weekly Read.
Hard Asset Strategist — Marcus Vasquez. All assets priced in gold terms. Responsible for identifying dollar-devaluation mispricing. Converts conventional valuations to gold-denominated equivalents as standard practice. Surfaces gold-denominated reads when the BTC/Gold ratio approaches structural levels or when the dollar regime shows signs of inflection.
Inflation & Real Asset Analyst — Sienna Whitfield. Assets priced against inflation. CPI, PPI, breakevens, real yields, commodity structures. Flags when nominal gains are real losses. Cross-checks apparent profit-taking — ensures harvest decisions are evaluated against real returns, not nominal.
Global Liquidity Director — Julian Harlow. Michael Howell’s Global Liquidity framework. Liquidity cycles, central bank balance sheets, cross-border credit creation. Primary interpreter of the weekly Howell report. Timeframe: years and cycles, not weeks. Anchors the team’s months-to-years time horizon.
Capital Flow Analyst — Priya Sandoval. Where liquidity moves once created. Cross-asset flows, fund positioning, ETF mechanics, derivatives positioning, futures term structure. Joint owner with the Fundamental Research Analyst of the weekly Glassnode read. Tracks where new liquidity routes — ETF flows, perpetual positioning, derivatives skew. Surfaces flow shifts that contradict the standing weekly synthesis.
Technical Analyst — Lukas Marchetti. Price action, structure, and pattern — calibrated to match the liquidity cycle timeframe. Weekly and monthly charts are primary. Daily charts are tactical. Sub-daily charts (4H and below) are activated only when the team has made a directional call and is executing an entry or take-profit. Technicals are treated as lagging confirmation of forward-looking macro and liquidity signals. Divergence between technicals and macro thesis is expected and discussed, not resolved by hierarchy.
Fundamental Research Analyst — Charlotte Donovan. Asset-level fundamentals. For Bitcoin: network economics, supply dynamics, miner behavior, adoption curves. For other assets as composition expands: applies an analogous fundamental frame. Joint owner with the Capital Flow Analyst of the weekly Glassnode read. Tracks supply-side dynamics — LTH/STH cohorts, miner state, on-chain cost-basis structure.
Lead Trader — Jordi Federer. Final decision authority on all position decisions. Domain: the book itself — capital allocation across the BTC leg, the ALT leg, and the BTC spot collateral reserve; entry, harvest, and restructure calls; risk tolerance and conviction-sizing at execution; the standing thesis that the eight specialists pressure-test against. Adjudicates specialist disagreement and rules on structural questions. Receives the team’s reads, challenges, and recommendations — then decides. The machine does not move without him.
The information is provided for information purposes only and on the basis that it will not be relied upon. No information contained herein constitutes a personal recommendation or investment advice.
The information (including any expressions of opinion or forecast) has been obtained from, or is based on, sources believed by the author to be reliable, but are not guaranteed as to their accuracy or completeness and should not be relied upon. The information is provided without obligation on the part of the author and on the understanding that any person who acts upon it or changes his investment position in reliance on it does so entirely at his own risk. The information does not constitute an offer to buy or sell or an invitation to make an offer to buy or sell any financial instrument.
Information is current only as at the date it is first posted and may no longer be true or complete when viewed by you. All information may be changed or amended without prior notice.
No representation, warranty or undertaking is given as to the accuracy or completeness of the information by the author and no liability is accepted by the author for the accuracy or completeness of such information. In no event will the author be liable to any person for any direct, indirect, special, or consequential damages arising out of any use of the information, including, without limitation, any lost profits.
You should be aware that the Internet is not a completely reliable transmission medium. The author does not accept any liability for any data transmission errors such as data loss or damage or alteration of any kind, including, but not limited to any direct, indirect or consequential damage, arising out of the use of the product or services referred to herein.
The materials provided here including text, photographs and other images, are protected by copyright and/or other intellectual property rights. All copyright (and any other intellectual property rights) in these materials is either owned by the author, or is used by the author under licence.