


Hayloo Unchained Trading Team — May 13, 2026
Contributors this week: Lead Trader, Chief Macro Strategist, Global Liquidity Director, Geopolitical Intelligence Officer, Hard Asset Strategist, Capital Flow Analyst, Fundamental Research Analyst.
Hayloo’s Macro Board
TL/DR
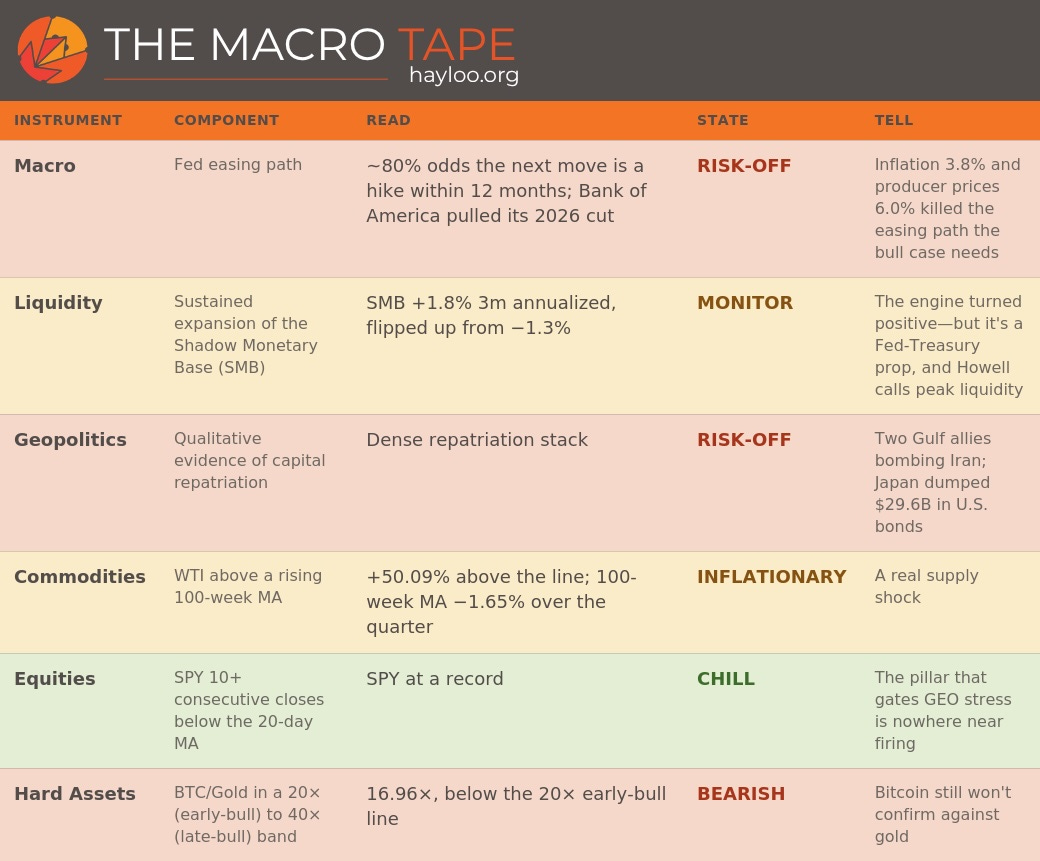
The geopolitical stack is the densest of the cycle, and the broad stress signal still stays dark. Reuters put Saudi Arabia’s late-March strikes on Iran on the record and the Wall Street Journal added the UAE—two Gulf allies at war with Iran outside Washington—while Japan dumped $29.6 billion in U.S. bonds and U.K. gilts hit multi-decade highs into a Thursday leadership fight. Oil backs it with a real supply shock at +50% above its 100-week line. But the convergence needs that line rising and equities rolling over, and neither is there—the 100-week average is falling and SPY sits at a record. The asymmetry is the read.
Hard assets: gold prices the tightening, not the refuge. BTC/Gold sits at 16.96×, still below the 20× line we treat as early-bull confirmation. The Gold/Oil ratio is compressing toward its long-run mean—but through oil rising, not gold falling.
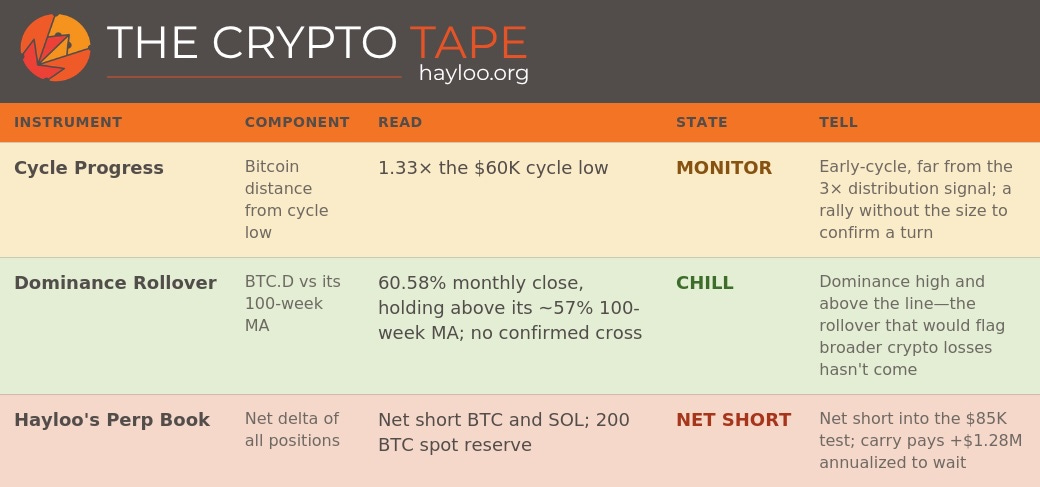
The book is net short into the test, and getting paid to wait. Net short BTC (11.78millionperpnotional)andnetshortSOL(9.5 million). Funding Rate Carry pays +$1.28 million annualized, +16.5% of equity. We didn’t chase the bounce.
Howell says the lift is engineered. Aggregate Global Liquidity rose to $191.8 trillion and the 3-month annualized rate jumped back to +7.8%; the engine underneath—the Shadow Monetary Base—flipped clearly positive at +1.8% from −1.3% a week ago. Michael Howell names the cause: a roughly $600 billion Fed-Treasury injection plus the Treasury actively suppressing bond-market volatility to lift collateral values. His own verdict on his own number is peak liquidity—broad-based risk gains hard to sustain at this late stage.
Glassnode says the demand is real and a third of the size it needs to be. Their report this week—titled Rally Without Conviction—has exchange-traded fund (ETF) inflows, Coinbase buying, and Hyperliquid positioning all turning constructive together for the first time this rally. The catch is magnitude: net capital into Bitcoin runs $2.8 billion/month against the $10 billion-plus/month that marked comparable early-rally turns in 2023–2025.
The macro tape went the other way the same week. April Consumer Price Index (CPI) printed 3.8% with hot services; Producer Price Index (PPI) printed 6.0%, the worst since December 2022. The 30-year Treasury yield sits at 5.03%, eight basis points off a 19-year high. Bank of America formally pulled its 2026 rate-cut call and pushed the first cut out to the back half of 2027. Warsh took his Board seat the same week the data killed the pre-emptive-cuts thesis he ran on.
Forward thesis: we expect $85K to reject. Three independently-derived levels sit at one band—our structural zone, Glassnode’s $86.9K cohort overhead, and the dealer-gamma positive cluster at $85K. The demand turned constructive; the macro that would convert it into sustained absorption got worse on the same trading week. If we’re right, BTC fails $85K and contracts toward $76.9K, then $68.5K through the June–July transmission window. The book stays net short.
Hayloo’s Crypto Board
Tape of the Week
The bull case has been quietly relying on a Fed easing path to bring in the buyers who would absorb the cohort that sells into strength near $85K. The April Consumer Price Index at 3.8% and a 6.0% Producer Price Index—the worst since December 2022—took that path away. Bank of America dropped its 2026 cut call outright. So the bullish read got its on-chain confirmation today and lost the macro it needs to cash that confirmation in, on the same trading week. Both things are true at once. They sharpen the question rather than settle it: does demand running at a third of cycle-turn size build toward the real thing, or fade before it gets there.
The book is positioned for the fade. BTC’s next attempt at $85K runs into three independently-derived obstacles that all sit at the same band—our structural zone, Glassnode’s $86.9K overhead-supply cohort, and the dealer-gamma positive cluster near $85K where dealer hedging actively dampens upside. We are net short into that test, the spot reserve sits passively underneath, and carry pays us to wait. We read the next several weeks as a rejection at the band and a contraction toward the cohort floors, not a clean breakout to new highs on a third of the fuel.
Geopolitical Tape
Institutional Capital Repatriation — the densest stack of the cycle fired this week:
Saudi Arabia conducted direct airstrikes on Iranian soil in late March, disclosed by Reuters today—the first known direct Saudi military action against Iran; the Wall Street Journal placed the UAE there too. Two of Washington’s largest Gulf allies are running their own war against Iran outside U.S. coordination.
Japan net-sold $29.6 billion of U.S. Treasuries, agency, and municipal bonds in the first quarter—the most since the second quarter of 2022—while its FY2025 current-account surplus hit a record ¥34.52 trillion. The largest creditor to the dollar system rotated out of Treasuries on a scale last seen in a crisis quarter.
U.K. Health Secretary Streeting is preparing to resign and challenge Starmer for the Labour leadership as soon as Thursday, against 30-year gilts at multi-decade highs and sterling under sustained pressure. The gilt move now has a Thursday catalyst.
Saudi crude production fell to its lowest since 1990 in April, reported to OPEC—the supply side of the same conflict.
🔴 This week’s Capital Flow evidence is on fire.
The Commodity Tape
Oil Price — WTI sustained above its 100-week MA, and the 100-week MA itself rising over a quarterly window.
WTI sits at $103 against a 100-week MA of 68.63—theleveltestpassesby + 50.0968.63) is lower than it was thirteen weeks ago ($69.78), down 1.65% over the quarter. Above the line, but the line is still falling.
The International Energy Agency (IEA) projected a 3.9 million barrel-per-day fall in global oil supply for 2026 on the Iran-war disruption, with cumulative Middle East losses already past a billion barrels. The Energy Information Administration’s path to cheaper crude by the fourth quarter assumes Hormuz traffic resumes from June—an assumption today’s Saudi-Iran kinetic disclosure makes harder. The supply shock is real and the prints back it. The trajectory pillar still mechanically fails, and that gap—maximum supply stress on the level while the longer trend stays down—is the read.
🟠 All Eyes on Oil This Week.
The Equity Tape
Equities — SPY 10+ consecutive daily closes below its 20-day MA.
SPY sits at $739, +4.44% above its 20-day MA and in record territory; the counter is 0/10. The pillar that gates broad stress is as far from firing as it has been all arc. The one crack worth marking: Micron fell about 10% on the day, the first chip-leader retreat of this advance, with the KOSPI down on a Samsung strike alongside it. A single-name wobble is not the index rolling over—but it is the first place the bid that has held equities at records has shown any give, and it is the proximate path under the only severe-stress pillar that is currently nowhere near triggering.
🟢 This week’s equity pillar is chill.
— Geopolitical Intelligence Officer (Margaux Lindqvist) · Chief Macro Strategist (Theodore Brennan)
Hard Assets
Gold sits at $4,688, down about $10 on the Producer Price Index print—the third consecutive session the hard-asset complex has priced the inflation read as a tightening signal that hurts risk, not a fear signal that bids gold for safety. The two hard-money trades are not confirming each other. The mechanical reads on the two ratios:
BTC/Gold at $79,507 / $4,688 = 16.96×. Still below the 20× line the framework treats as early-bull confirmation, and a universe away from the 40× prior-peak territory our exit calibration watches. Bitcoin has not yet earned the confirmation against gold that an early bull would show.
🔴 This week’s BTC/Gold ratio sits below the early-bull line.
Gold/Oil at $4,688 / $103 = 45.5×. Compressing—down from 52.4× on May 5—and compressing the healthy way. Howell’s rule on this ratio is that roughly 90% of any mean-reversion toward the ~20× long-run average comes through oil rising rather than gold falling, and that is exactly what is happening here. The level is still far above the 15× to 25× band that marks economic health; the direction is the right one.
The one watch item under gold is the one Howell flagged himself: People’s Bank of China (PBoC) liquidity injections sharply fell off from late April through the May 8 data, against his own easing baseline. His framework runs Yuan gold pricing into U.S.-dollar gold pricing, so if that PBoC pause sustains, the structural anchor under gold weakens. The PBoC trajectory is the leading indicator on whether gold extends or fades from here.
🔴 This week’s Gold/Oil ratio is elevated but mean-reverting the right way.
— Hard Asset Strategist (Marcus Vasquez)
Position Tape
Size and direction. We carry $7.76 million in wallet equity, up 5.49% on the session as BTC and SOL pulled back and our net-short legs benefited. The book is net short.
Funding Rate Carry. Running positive at +1.28millionannualized, + 16.53,504/day net across the four legs. The wait is being paid well.
Next levels that fire. Overhead, the band that has to break before any of this reverses: $85K to $87K (our Short Add S1 and Take-Profit L1, Glassnode’s $86.9K cohort overhead, the dealer-gamma positive cluster). On the downside, where the book works: $76.9K (the recent-buyer cohort floor) and $68.5K (Long Add L1). On the SOL leg: $112.50 (Short Add S1, well above spot) and $83 (Take-Profit S1, the nearer long-side harvest).
Position vs. thesis. The book is positioned for a rejection at the band. If it fails—a clean BTC weekly close above $85K with real spot demand, not a perp short squeeze—Position Read re-evaluates at the next weekly run against the five named conditions in the Forward Thesis below.
🔴 Our Perp Book Is Net Short.
— Lead Trader (Jordi Federer)
Liquidity Tape
Howell’s number this week is unambiguous on direction. Aggregate Global Liquidity rose to $191.8 trillion; the 3-month annualized growth rate is back to +7.8%, the pace last seen in late 2025, with the annual rate at +6.7%. The engine underneath—the Shadow Monetary Base, central-bank liquidity plus collateral—is now clearly positive on both timeframes at +1.8% three-month annualized and +3.0% annual, against −1.3% a week ago. That is a sharp, real turn. It turned because the Fed and the Treasury made it turn.
Howell names the drivers precisely: a roughly $600 billion Fed-Treasury injection he quantified going back to late October, a weaker U.S. dollar lifting the dollar value of non-U.S. liquidity and collateral, and a fall in bond-market volatility he flags as unnatural. The measure of Treasury-bond implied volatility sits near 70, down from 115 in mid-March, and Howell concludes the Treasury is deliberately targeting it. Falling bond volatility cuts the haircuts on collateral, which lets dealers create more credit against the same collateral—and that multiplier is doing most of the work in the headline number. Against it: PBoC tightening, continued Bank of Japan balance-sheet runoff, and weak European Central Bank and Bank of England.
🟠 The liquidity engine turned positive this week—but it’s engineered, and Howell calls peak liquidity.
— Global Liquidity Director (Julian Harlow)
On-Chain Tape
Glassnode’s Rally Without Conviction is genuinely two-sided, and worth taking seriously on both halves.
The constructive half is real, and it is the first time this rally the bullish signals have fired together. ETF inflows have turned firmly positive after months of inconsistent demand. Coinbase buying turned constructive—the precise signal we named at the start of the month as one of the things that would have to change for us to be wrong.
Net capital flowing into Bitcoin runs about $2.8 billion/month at this rally pace. At every comparable early-rally moment across 2023–2025, this same measure accelerated from roughly $2 billion toward $10 billion/month. We are running at about a third of the speed that previously marked a cycle turn. The demand is there. It is not there in the size that has historically defined a bottom, and the size is what decides whether the constructive half sustains or fades.
The cohort structure is the cleanest thing in the report. The cohort that bought in the last month sits near $76.9K—the immediate support floor. The cohort that accumulated through the November-to-February range sits at $86.9K—the overhead supply, investors approaching breakeven with every incentive to sell into strength. Spot at $79,507 sits in between, holding above both the True Market Mean (TMM) at $78.2K for a twelfth straight session and the short-term-holder cost basis at $79.1K by a few hundred dollars. And $86.9K sits within a thousand dollars of our own structural zone at $85K—three different ways of finding the same overhead band.
There is a live split on the desk worth naming rather than papering over. Our capital-flow read and our fundamental read have diverged for two weeks on the one question the magnitude forces: does demand at a third of cycle-turn size build toward the real thing, or fade before it gets there. This week’s print sharpens the question without answering it. The resolver is concrete and close—the next two weekly on-chain reads either show the net-inflow pace accelerating off $2.8 billion toward the $10 billion that marked prior cycle turns, or they don’t. We are not manufacturing a verdict the data has not delivered.
🟠 This week’s on-chain read is constructive but undersized—real demand, a third of the size a turn needs.
— Capital Flow Analyst (Priya Sandoval) · Fundamental Research Analyst (Charlotte Donovan)
Macro Tape
The macro tape loaded one direction every session this week, and it is the direction that removes the bull case’s one requirement—a Fed easing path. April’s CPI printed 3.8% headline with core at 2.8%, and the detail the Fed treats as underlying inflation—core services excluding housing—ran +0.45% month-on-month, its third-highest reading since January 2025. Then PPI printed 6.0% year-on-year against 4.9% expected, the worst since December 2022, with March revised up and the trimmed-mean CPI—a metric Warsh has specifically named as one he watches—posting its biggest monthly rise since January 2024. The 30-year Treasury yield sits at 5.03%, eight basis points off a 19-year high, with the 10-year at its highest since July.
The pricing followed. Futures now put roughly 80% odds on the Fed’s next move being a hike within twelve months, not a cut. Bank of America formally dropped its 2026 rate-cut call and pushed the first cut out to the back half of 2027—the largest single-day repricing of the cut-path read we have been carrying. Warsh was confirmed to the Board 51-45 the same week, with the June 16–17 Federal Open Market Committee (FOMC) meeting now the first reading under either Powell staying or Warsh running, against a 3.8% / 6.0% inflation stack. The pre-emptive-cuts platform Warsh ran on lost its data cover the week he got the seat.
Why this matters for the book: the bullish case needs a Fed easing path to bring in the buyers who would absorb the cohort Glassnode flags at the overhead band. The prints this week take that path away. The bullish read got its on-chain confirmation today, and the environment it needs to convert that confirmation into sustained absorption got materially worse on the same trading week. The macro that delivered nothing for the bears in price this week is the macro that validates the short into the test.
🔴 This week’s Macro Tape points to a risk-off regime.
— Chief Macro Strategist (Theodore Brennan)
Forward Thesis
We expect BTC’s next attempt at $85K to fail. The reasoning is concrete, not a vibe—three independently-derived levels at one band: our own structural zone (Short Add S1 and Take-Profit L1, both at $85K); Glassnode’s cohort-derived overhead supply at $86.9K, investors from the November-to-February range approaching breakeven with a clear incentive to sell into strength; and the dealer-gamma positive cluster at $85K, where dealer hedging actively dampens upside. The bullish case got its on-chain confirmation this week—Coinbase, Hyperliquid, the ETF turn—and lost the Fed easing path it needs to convert that confirmation into sustained absorption. Glassnode tells us the demand is real and running at about a third the size prior inflections delivered; the macro tape just told the Fed it cannot cut.
If we are right, BTC retests $85K and fails, the long take-profit fires on contact, and the short add is evaluable at trigger. First target $76.9K, the recent-buyer cohort floor; deeper target $68.5K, our Long Add L1, inside the June–July transmission window Howell’s framework names. If we are wrong—a clean BTC weekly close above $85K with sustained spot demand, a real spot bid rather than a perp short squeeze—we re-evaluate Position Read at the next weekly run.
We hold this read with respect for the counter-signals, which are real: relative unrealized loss has compressed to 8%, a shallow bear regime so long as $60K holds; the Coinbase turn is the bullish signal we named ourselves; and Hyperliquid’s long bias is rebuilding the healthier, gradual way. The bear-continuation read dominates, but the thing that would change it is concrete.
What would change our mind. Five conditions, any two firing together triggering Position Read re-evaluation at the next weekly run:
Net Bitcoin inflows accelerating off $2.8 billion/month toward $5 billion-plus. The $10 billion-plus/month pace marked the prior cycle’s inflection; a sharp acceleration toward it materially shifts the read. Not there.
Sustained $1.5 billion-plus weekly ETF net inflows across two consecutive weeks, with Coinbase breadth. Coinbase breadth turned constructive this week; the sustained size is the open axis. Partially there.
A BTC weekly close above $87K with sustained spot demand—a clean close, not a wick, not a derivatives squeeze. Spot needs +9.4%. Not there.
SMB three-month annualized clearly positive across two consecutive months. This week was print one; the counter is 1 of 2.
The severe-stress equity pillar firing—SPY closing below its 20-day MA ten times in a row. The counter is 0/10 and SPY is +4.44% above, at a record. This is the one condition that would escalate the read rather than relax it.
The deciding axis runs through conditions 1 and 2—whether the size of on-chain demand shows up in the next two reads. This week’s number does not deliver it. The book stays net short into the test.
— Lead Trader (Jordi Federer)
Watchlist
BTC at $85–87K — our zone, Glassnode’s cohort overhead, and the dealer-gamma positive cluster all here. Distance +6.91%, the first session outside the 5% band since May 5. Long take-profit fires on contact; short add evaluable at trigger.
BTC at $82K — dealer-gamma negative cluster, about $2.6 billion. A move back here triggers reactive hedging that amplifies the move. Distance +3.14%.
BTC at $76.9K — the recent-buyer cohort floor and immediate support. Spot above by $2,607.
BTC at $68,500 — Long Add L1, the deeper contraction target inside the transmission window. Distance −13.85%.
SOL at $112.50 — alt-leg Short Add S1, well above spot at +23.41%.
SOL at $83 — alt-leg Take-Profit S1, the nearer long-side harvest at −8.95%.
Net Bitcoin inflow pace — $2.8 billion/month today against the $10 billion-plus that marked prior cycle turns. The deciding on-chain size metric.
Coinbase buying sustained alongside ETF inflows — Glassnode called this constructive today. Two weeks of sustained behavior plus size is the bullish-side invalidation pair.
SMB three-month annualized, next print — +1.8% today, the first clearly-positive month. A second consecutive positive month, not a single one, is what resets the macro read.
Bond-market volatility — near 70, Treasury-suppressed per Howell, against his named threshold of 80. A re-spike reverses the multiplier expansion carrying the headline liquidity number.
30-year Treasury yield — 5.03%, eight basis points off a 19-year high. Howell’s bearish-flattening watch compresses right here.
BTC.D — 60.58% monthly close, holding above its ~57% 100-week MA. No rollover; the cross that flags broader crypto losses has not come.
Trump-Xi summit May 13–15 and the Warsh chair vote — calendar collision; trigger-class events possible.
CLARITY Act markup May 14 — 100-plus amendments, committee passage genuinely contested.
The Hayloo Unchained Team
Chief Macro Strategist — Theodore Brennan. Macroeconomic cycles, central bank policy, growth and recession dynamics, sovereign debt, currency regimes. Anchors daily and weekly reads to the current macro regime. Flags regime shifts as they materialize.
Geopolitical Intelligence Officer — Margaux Lindqvist. Geopolitical risk, capital flow implications of conflict and alliance shifts, sanctions, resource competition, regime stability. Integrates the daily news brief into the daily synthesis. Maps geopolitical events to severe-stress convergence components and to capital flow implications. Surfaces brief-content tensions with the Standing Weekly Read.
Hard Asset Strategist — Marcus Vasquez. All assets priced in gold terms. Responsible for identifying dollar-devaluation mispricing. Converts conventional valuations to gold-denominated equivalents as standard practice. Surfaces gold-denominated reads when the BTC/Gold ratio approaches structural levels or when the dollar regime shows signs of inflection.
Inflation & Real Asset Analyst — Sienna Whitfield. Assets priced against inflation. CPI, PPI, breakevens, real yields, commodity structures. Flags when nominal gains are real losses. Cross-checks apparent profit-taking — ensures harvest decisions are evaluated against real returns, not nominal.
Global Liquidity Director — Julian Harlow. Michael Howell’s Global Liquidity framework. Liquidity cycles, central bank balance sheets, cross-border credit creation. Primary interpreter of the weekly Howell report. Timeframe: years and cycles, not weeks. Anchors the team’s months-to-years time horizon.
Capital Flow Analyst — Priya Sandoval. Where liquidity moves once created. Cross-asset flows, fund positioning, ETF mechanics, derivatives positioning, futures term structure. Joint owner with the Fundamental Research Analyst of the weekly Glassnode read. Tracks where new liquidity routes — ETF flows, perpetual positioning, derivatives skew. Surfaces flow shifts that contradict the standing weekly synthesis.
Technical Analyst — Lukas Marchetti. Price action, structure, and pattern — calibrated to match the liquidity cycle timeframe. Weekly and monthly charts are primary. Daily charts are tactical. Sub-daily charts (4H and below) are activated only when the team has made a directional call and is executing an entry or take-profit. Technicals are treated as lagging confirmation of forward-looking macro and liquidity signals. Divergence between technicals and macro thesis is expected and discussed, not resolved by hierarchy.
Fundamental Research Analyst — Charlotte Donovan. Asset-level fundamentals. For Bitcoin: network economics, supply dynamics, miner behavior, adoption curves. For other assets as composition expands: applies an analogous fundamental frame. Joint owner with the Capital Flow Analyst of the weekly Glassnode read. Tracks supply-side dynamics — LTH/STH cohorts, miner state, on-chain cost-basis structure.
Lead Trader — Jordi Federer. Final decision authority on all position decisions. Domain: the book itself — capital allocation across the BTC leg, the ALT leg, and the BTC spot collateral reserve; entry, harvest, and restructure calls; risk tolerance and conviction-sizing at execution; the standing thesis that the eight specialists pressure-test against. Adjudicates specialist disagreement and rules on structural questions. Receives the team’s reads, challenges, and recommendations — then decides. The machine does not move without him.
The information is provided for information purposes only and on the basis that it will not be relied upon. No information contained herein constitutes a personal recommendation or investment advice.
The information (including any expressions of opinion or forecast) has been obtained from, or is based on, sources believed by the author to be reliable, but are not guaranteed as to their accuracy or completeness and should not be relied upon. The information is provided without obligation on the part of the author and on the understanding that any person who acts upon it or changes his investment position in reliance on it does so entirely at his own risk. The information does not constitute an offer to buy or sell or an invitation to make an offer to buy or sell any financial instrument.
Information is current only as at the date it is first posted and may no longer be true or complete when viewed by you. All information may be changed or amended without prior notice.
No representation, warranty or undertaking is given as to the accuracy or completeness of the information by the author and no liability is accepted by the author for the accuracy or completeness of such information. In no event will the author be liable to any person for any direct, indirect, special, or consequential damages arising out of any use of the information, including, without limitation, any lost profits.
You should be aware that the Internet is not a completely reliable transmission medium. The author does not accept any liability for any data transmission errors such as data loss or damage or alteration of any kind, including, but not limited to any direct, indirect or consequential damage, arising out of the use of the product or services referred to herein.
The materials provided here including text, photographs and other images, are protected by copyright and/or other intellectual property rights. All copyright (and any other intellectual property rights) in these materials is either owned by the author, or is used by the author under licence.