


Tape of the Week
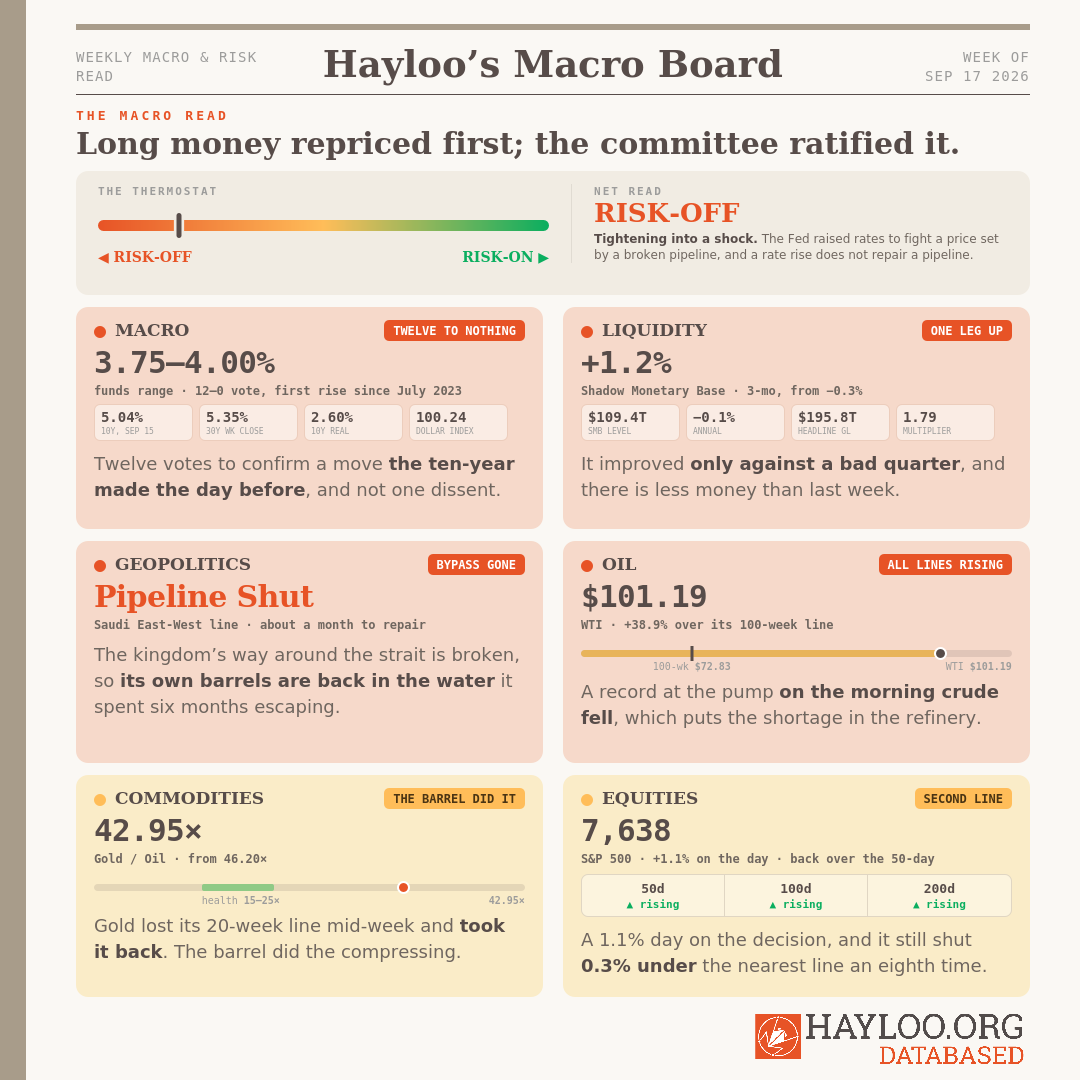
The ten-year Treasury yield reached 5.04% on September 15, its highest since 2007. The Federal Reserve met the next morning and raised a quarter point, twelve votes to none. Long money repriced itself ahead of the Fed. The board only got to confirm with a vote. The ten-year gave nine basis points back on the 17th, to 4.95%. The mechanics are working.
The Treasury did try to hold the long end down, and it failed publicly: a buyback three times the usual size, and the long end has since reached its highest yield in nineteen years 5.35% on the weekly close.
The prices doing all the damage are set outside Washington: crude is $101.19 and headline inflation is 3.4%. Saudi Arabia’s East-West pipeline is shut, a tanker on the Gulf-to-China run was hired at $1.035 million a day, and American retail diesel set a record at $6.29 a gallon. A quarter point on the funds rate reaches none of that. The Federal Reserve does not move tankers, does not move oil, does not run refineries. It moves money overnight. Moving money overnight does not solve any of the problems at hand.
Headline global liquidity, collateral values, bond volatility, and the dollar peaked higher without a dollar being printed this week. A quiet bond market allows for the same collateral to support more borrowing, jacking up a headline number arithmetically, while global liquidity itself fell for a second consecutive week.
Macro Tape: A Unanimous Hike Into a Supply Shock
The Fed raised a quarter point to 3.75%–4.00% on September 16, its first increase since July 2023. The market had the move priced in. Producer prices rose 5.4% on the year against a 5.1% forecast and core consumer inflation rose 0.3% on the month against 0.2% expected – proof for every board member that a hike was needed. What president Trump won in return, is someone else to blame for his policy missteps.
The question is what the Fed interest rate actually reaches. The barrel is priced by bombed infrastructure and expensive underwriting of passage through a war zone. The Fed can not produce, transport, or refine oil.
Long money is priced by the bond market; and the ten-year hit 5.04% before the Fed even sat down to cast a vote. The Fed’s overnight rate is not an input that keeps economists up at night these days. The bond market is the captain now.
Goldman expects the Fed to hike again in October. It would land with the war’s inflation bill still unpaid: a congressional scorekeeper puts the Iran conflict at $38 billion and half a percentage point of inflation in early 2027. So far, the Fed only rose interest rates by half of that. To be continued…
🔴 The 10-year bond set the price on Tuesday and the Fed ratified it on Wednesday.
— Chief Macro Strategist (Theodore Brennan)
Liquidity Tape: The Headline Number Turned Up on Arithmetic, Liquidity Kept Falling
Headline global liquidity set another record this week, but growth has been slowing noticeably since summer. The record headline number is coming from cheap collateral, enabled by an artificially quiet bond market.
More dollars get borrowed against the same collateral, and that multiplier is where all the growth in this summer’s liquidity data comes from. No new money entered the economy, liquidity creation stalled in February and has not restarted.
After the Fed raised the overnight interest rate, the dollar took back its 20-week moving average, which removes one of the pillars these arithmetically fabricated record liquidity numbers are standing on. What is left is bond calm, and we are entertaining the possibility that the calm has a deadline. It may very well be the precursor of a bigger storm.
The slowing liquidity cycle adds pressure to risk assets through the fourth quarter of 2026. We do not expect a liquidity floor from Fed or Treasury to be poured before spring 2027.
🔴 The weak dollar propping up headline liquidity went away this week.
— Global Liquidity Director (Julian Harlow)
Geopolitical Tape: The Strait’s Broken Bypass
Saudi Arabia built the East-West pipeline so that its crude would never have to pass Hormuz. That line has been shut with heavy damage. The repair is quoted at about a month.
So the Saudi kingdom’s barrels went back into the strait. Riyadh spent six months keeping its cargoes out of that water. It is the only route left. That hands the pricing of Saudi crude to the people underwriting insurance for these voyages. Tankers on the benchmark Gulf-to-China route were hired this week at $1.035 million a day.
🔴 Saudi crude prices off the cost of a million dollars a day now.
— Geopolitical Intelligence Officer (Margaux Lindqvist)
Commodity Tape: The Oil Shortage ends up in the Headline Print the Fed Votes on
West Texas Intermediate (WTI) sits at $101.19, which is 38.9% above its 100-week average of $72.83, and that average has itself climbed 1.96% over thirteen weeks. Brent held above $107 for most of this week, and WTI closed at $102.45, its 10th consecutive weekly close above the average.
The shortage has moved down the chain, ending up in the headline print the Fed just voted on. American retail diesel set a record at $6.29 a gallon on September 17, on a morning crude actually fell. This is a shortage in refining capacity. No pipeline repair builds a refinery.
🔴 Diesel set a record on the morning crude fell, so the squeeze is in refining now.
— Inflation & Real Asset Analyst (Sienna Whitfield)
Hard Assets: Gold Competes with Attractive Yields
Gold was flat this week, and the ratio over oil compressed anyway: 42.95 barrels an ounce: crude’s completed weekly close rose 11.2% while gold’s fell 1.2%. The ratio is still more than twice its long-run mean, and has a long way to travel. Bitcoin over gold reads 17.58×, short of the 20× we treat as an early-bull signal.
The People’s Bank of China stays on the support side of gold, but its liquidity injections are decelerating. Michael Howell’s Capital Wars puts Chinese liquidity growth at modestly positive, which is still enough to keep pouring a $4000 floor under gold. But the line any gold bug should really watch is the one of real yields: The ten-year comes in at an attractive 2.60%. It’s the dollar competing with gold.
🟠 The Beijing liquidity underwriting gold is slowing.
— Hard Asset Strategist (Marcus Vasquez)
Equity Tape: The AI Build-out and Who is Lending to It
The S&P 500 closed at 7,638 on September 17, up 1.1% on the day the Fed moved. The shape underneath equities, however, changed this week. Weakness reached the 50-day line with the 20-day line falling.
The bear case on the artificial-intelligence trade has always been that demand would disappoint. This week’s objection came from the supply side, when the heads of Anthropic and OpenAI called for a slowdown in frontier development.
We read that call as a negotiating position. Two companies whose largest input cost is silicon have threatened the industry to buy less of it.
🟠 Weakness reached the 50-day moving average.
— Technical Analyst (Lukas Marchetti)
Saturday: Hayloo’s Crypto-Tape Week 38
When The Fed Came Around, Every Bitcoin Buyer Went Home
On our use of AI:
We’re a private crypto fund out of Switzerland. We built a Neurosymbolic Compound AI System for our own desk: it follows our strategies, it reads the news that affect our portfolio, it sits on a database going back decades, and brings math to our everyday emotions. We call it Hayloo. It’s our best hire. This Substack is compiled by Hayloo and written by us.
Humans have written machine-assisted for centuries. What never changes is who decides.
Nothing at Hayloo INC. was ever decided by a machine.
What we publish is what we defend as a team. When it’s wrong, it’s wrong because humans signed it.
Jordi Federer, Founder, Hayloo INC.
Disclaimer
The information is provided for information purposes only and on the basis that it will not be relied upon. No information contained herein constitutes a personal recommendation or investment advice.
The information (including any expressions of opinion or forecast) has been obtained from, or is based on, sources believed by the author to be reliable, but are not guaranteed as to their accuracy or completeness and should not be relied upon. The information is provided without obligation on the part of the author and on the understanding that any person who acts upon it or changes his investment position in reliance on it does so entirely at his own risk. The information does not constitute an offer to buy or sell or an invitation to make an offer to buy or sell any financial instrument.
Information is current only as at the date it is first posted and may no longer be true or complete when viewed by you. All information may be changed or amended without prior notice.
No representation, warranty or undertaking is given as to the accuracy or completeness of the information by the author and no liability is accepted by the author for the accuracy or completeness of such information. In no event will the author be liable to any person for any direct, indirect, special, or consequential damages arising out of any use of the information, including, without limitation, any lost profits.
You should be aware that the Internet is not a completely reliable transmission medium. The author does not accept any liability for any data transmission errors such as data loss or damage or alteration of any kind, including, but not limited to any direct, indirect or consequential damage, arising out of the use of the product or services referred to herein.
The materials provided here including text, photographs and other images, are protected by copyright and/or other intellectual property rights. All copyright (and any other intellectual property rights) in these materials is either owned by the author, or is used by the author under license.