


Tape of the Week
The Iran war de-escalated into a signed deal and West Texas Intermediate (WTI) crude fell. Michael Howell’s headline liquidity printed a new high at $193.7 trillion while the engine underneath it ran on a base effect and suppressed bond volatility — the FOMC is doing exactly what the new chair will have to: lean hawkish to keep the bond market disciplined.
Warsh’s first Federal Open Market Committee (FOMC) meeting flipped its 2026 dot plot from a cut to a hike. Crypto fell on it and Hayloo’s net-short book took in roughly $889,000 in a single session. Peace removed a tail risk, but the Fed castrated the catalyst.
Exchange-traded fund (ETF) flows swung back to outflow as the rate-cut hope died. The buyer that confirms a floor is still missing on every channel we watch, and the Fed just made upside the less likely break.
Hayloo’s Beta Desk measures how the major crypto assets outside Bitcoin move against the king coin, and beneath the surface, the crypto market stopped moving in sync. Bitcoin’s market share keeps falling below its averages, which our desk reads as a broad liquidity drawdown — flagging the scatter without calling the turn.
The next four to twelve weeks read lower-to-choppy into a late-August liquidity-transmission window — and the FOMC made that transmission actionable rather than speculative. We are prepared to buy $55,000 Bitcoin this summer.
Macro Tape
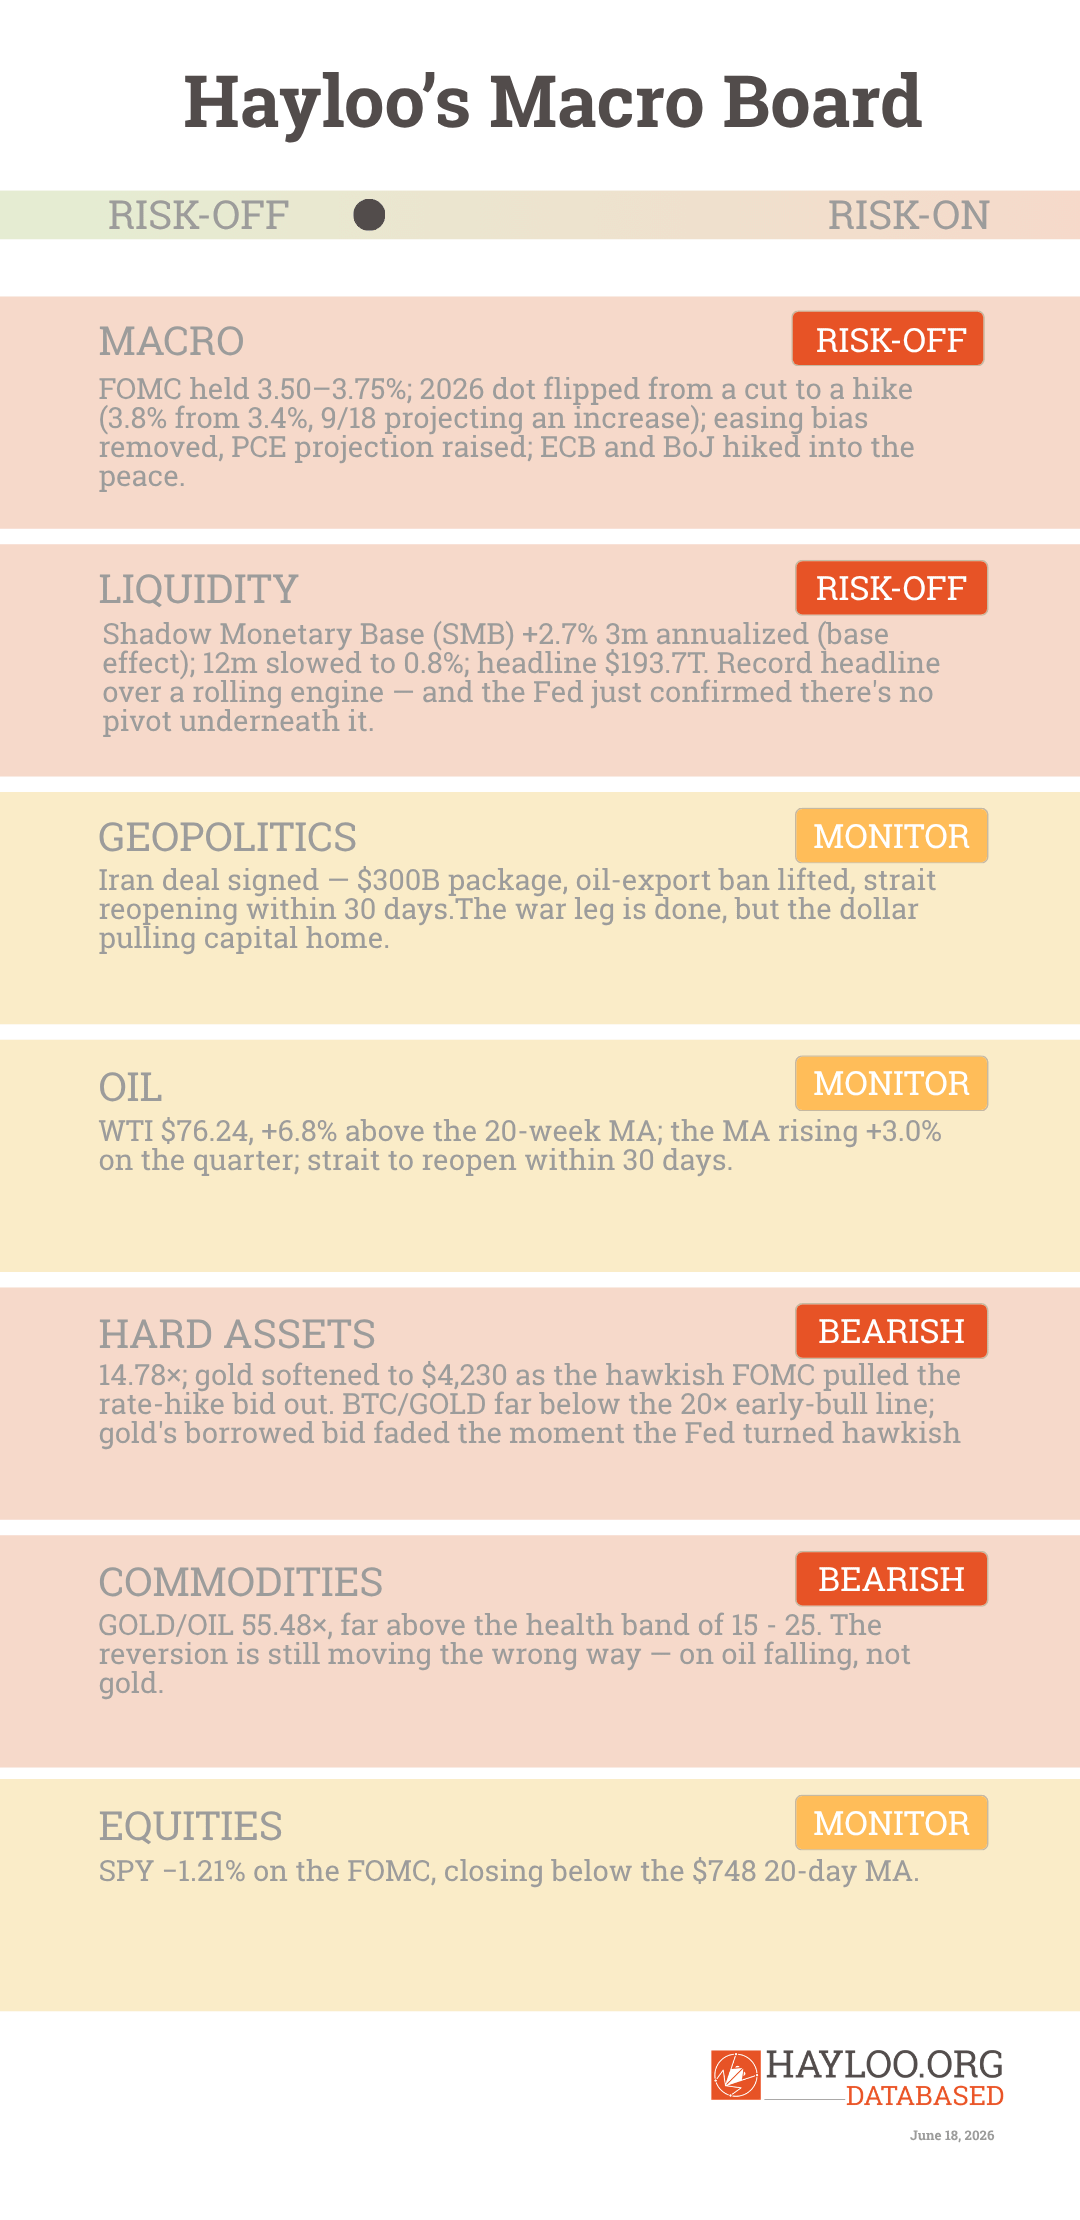
Warsh’s first Federal Open Market Committee (FOMC) meeting held what everyone expected, and then flipped all the hopes for a dovish projection. The 2026 median dot moved from a cut to a hike, with nine of eighteen members now projecting an increase by year-end; the easing bias was stripped from the statement, the 2026 inflation projection was raised to 3.6%, and Warsh declined to submit his own dot at all. The statement ran about 115 words. This is a chair who dislikes forward guidance signaling, on his first day. The S&P fell below its 20-day moving average on the announcement.
The data underneath had been pointing this way all week. May producer prices ran the hottest since November 2022 and electronics-led — the chipflation channel one stage upstream of the consumer — May retail sales beat at +0.9% with a strong control group, and on June 18 Apple’s chief executive confirmed the pass-through out loud, saying prices will rise on memory-chip costs. The European Central Bank (ECB) hiked for the first time since 2023, the Bank of Japan (BoJ) went to a 31-year-high 1.0%, the Bank of England (BoE) held, and Indonesia and the Philippines hiked again to defend their currencies as the yen pressed a 40-year low.
🔴 This week’s macro tape hardened: the dot plot flipped from a cut to a hike, and the central banks tightened through the peace.
— Chief Macro Strategist (Theodore Brennan)
Geopolitical Tape
The United States and Iran signed an interim memorandum on June 18 — a $300 billion package, the oil-export ban lifted, the Strait of Hormuz set to reopen within 30 days — and the shooting stopped. The hard part has not started: the nuclear program, the whole reason for the war, is a 60-day promise to negotiate, Trump has already said he will resume strikes if Iran fails to hold, and Israel kept hitting Lebanon through the week. The war is standing down, but a hawkish Fed sends the dollar higher and forces everyone else to defend, with Indonesia three hikes deep in a month, the Philippines two, and the yen at a 40-year-low threshold.
🟠 This week’s geopolitical landscape is cautiously stabilizing, with the war signed off, but a Fed-driven dollar repatriation taking its place.
— Geopolitical Intelligence Officer (Margaux Lindqvist)
The Commodity Tape
WTI eased to $76.24, but remains +6.8% above a rising 100-week moving average at $71.41, down from about +27% in late May — the war premium is essentially spent, the strait is set to reopen within 30 days, which removes the supply tail the market never paid for in the first place. But the supply side the market is pricing as resolved has more than one hand on it.
🟠 The Oil Price fell significantly, but holds above a rising 100-week moving average.
— Hard Asset Strategist (Marcus Vasquez) · Geopolitical Intelligence Officer (Margaux Lindqvist)
The Equity Tape
The FOMC sent the S&P below the 20-day moving average, the same Fed the whole structural case rests on. A valuation rethink under higher-for-longer rates is the 2022 mechanism, and the chip index that led the prior rout is still bluntly priced.
🟠 Equities begin to price in a hawkish Fed.
— Capital Flow Analyst (Priya Sandoval) · Chief Macro Strategist (Theodore Brennan)
Hard Assets
Gold’s week is the inverse of the war-premium trade, and the FOMC put a cap on it. Gold fell into the conflict, rose into the de-escalation and then softened the moment Warsh turned hawkish. The gold-to-oil ratio sits at 55.48×, still wide and still moving the wrong way — but it is moving because oil keeps falling, not because gold is falling, so the mechanism’s direction is unresolved.
BTC/Gold sits at 14.78×, well below the 20× early-bull confirmation and a universe from the 40× cycle-peak reference — the two hard-money trades still pulling apart, not confirming each other. Nothing in the hard-asset reads challenges the macro view; the dominant signal is liquidity-engine deterioration, not a flight to or from real assets.
🔴 This week’s hard-asset ratios stay bearish, and gold’s bid faded the moment the Fed turned hawkish.
— Hard Asset Strategist (Marcus Vasquez)
Liquidity Tape
Global liquidity edged to a record $193.7 trillion with three-month annualized growth at a seven-month high of 10.7% — and the engine underneath it is weaker than the headline, exactly as it has been for a month. The Shadow Monetary Base (SMB) ticked up to a +2.7% three-month rate, but Howell calls the improvement “largely a base effect” and the twelve-month rate slowed to 0.8%; there is no central-bank pivot under this print, only suppressed bond volatility — the MOVE index of Treasury-bond volatility had fallen below 70 — inflating the collateral value that drives the headline number. The lift is the volatility-suppression trade, not money creation.
Liquidity is past its peak and falling, with gold and crypto leading the turn. Warsh’s first FOMC flipped the dot plot to a hike, stripped the easing bias, raised the inflation projection — and the 10-year backed up toward 4.50% while the MOVE index ticked back to 70.66 on the day.
🔴 This week’s liquidity tape points to risk-off — and the Fed just confirmed there’s no pivot under the headline.
— Global Liquidity Director (Julian Harlow)
On-Chain Tape
Glassnode upgraded the read from capitulation to “a market in repair,” and the upgrade is real but unconfirmed. Bitcoin continues to trade to a discount to the True Market Mean (TMM) of $77,200, Short-Term Holder profitability recovered while staying below breakeven, with that cohort’s cost basis near $72,600 still overhead.
Glassnode’s own framing is that the recovery off the early-June low was “repricing the absence of a headwind” — the war premium leaving — not demand arriving, and the named conditions for a regime turn are explicit and unmet: reclaim the TMM at $77,200, push MVRV back above 1.0, and turn Realized Capitalization positive on the 90-day horizon, which sits down 1.45% and decelerating rather than inflecting.
The flow scorecard reads the same shape and lands on “a consolidation base, not a reversal” — selling pressure paused, buying pressure unconfirmed. The spot ETFs swung back to net outflow. The bid is still the missing piece — spot order flow near breakeven on a passive Binance bid, the Coinbase and US-institutional bid absent — while the supply side keeps working against the bounce: Bhutan moved another 533 Bitcoin to Binance, extending sovereign selling past 10,000 coins since last June, and Grayscale moved 1,863 to Coinbase the same day. A market this primed moves fast in whichever direction demand finally picks; it has not picked, and the Fed just made a case for more downside.
🔴 This week’s on-chain read is no recovery without a buyer.
— Capital Flow Analyst (Priya Sandoval) · Fundamental Research Analyst (Charlotte Donovan)
The Beta Desk
When altcoins stop moving together
The Beta Desk · Hayloo Unchained · week of June 16, 2026
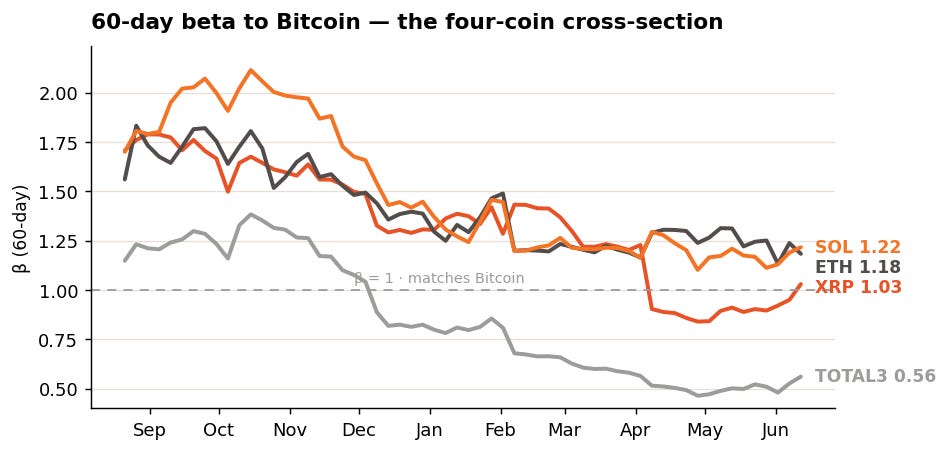
Hayloo’s Beta Desk measures how crypto assets move against Bitcoin — not their price, but their beta: how much of each Bitcoin move they capture on the way up, and how much they give back on the way down. This week the four stopped agreeing.
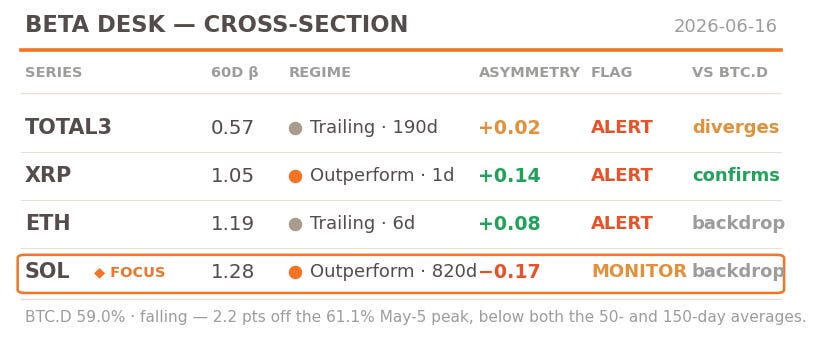
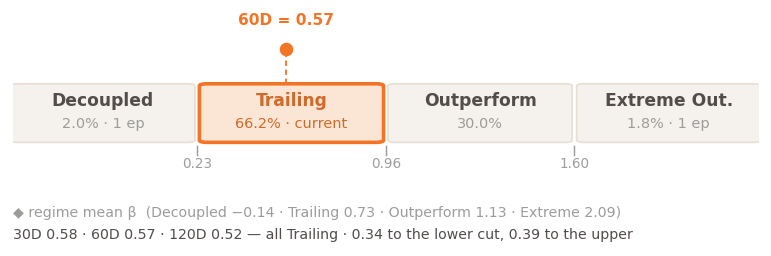
They sit in three different regimes: TOTAL3 — the broad basket of altcoins outside Bitcoin and Ethereum — has trailed Bitcoin for 190 days, catching 57 cents of each Bitcoin move; SOL has led for 820 days, the longest streak on record; XRP crossed back into Outperform a day ago; and ETH settled into Trailing six days ago, after whipsawing across the line four times the week before. When the market moves as one it is a beta market and everything tracks Bitcoin; when they scatter like this, the individual names matter again.
Bitcoin dominance — the backdrop they all trade against
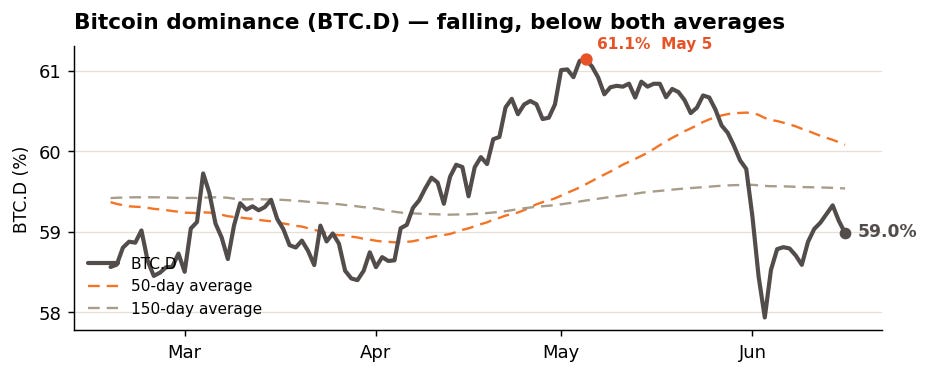
Bitcoin dominance is 59.0% and falling — 42 days and 2.1 points off its 61.1% peak on May 5, now below both its 50-day (60.1%) and 150-day (59.5%) averages. Falling dominance means Bitcoin is losing share of the whole crypto market and altcoins are gaining it; this is market-wide context, the risk posture of the entire board, not any single coin’s read.
TOTAL3 — even, for the first time in 190 days
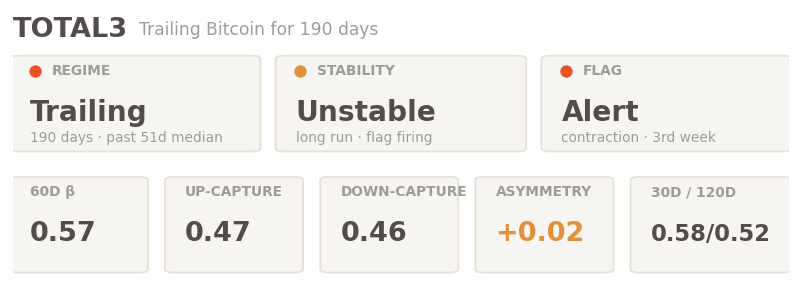
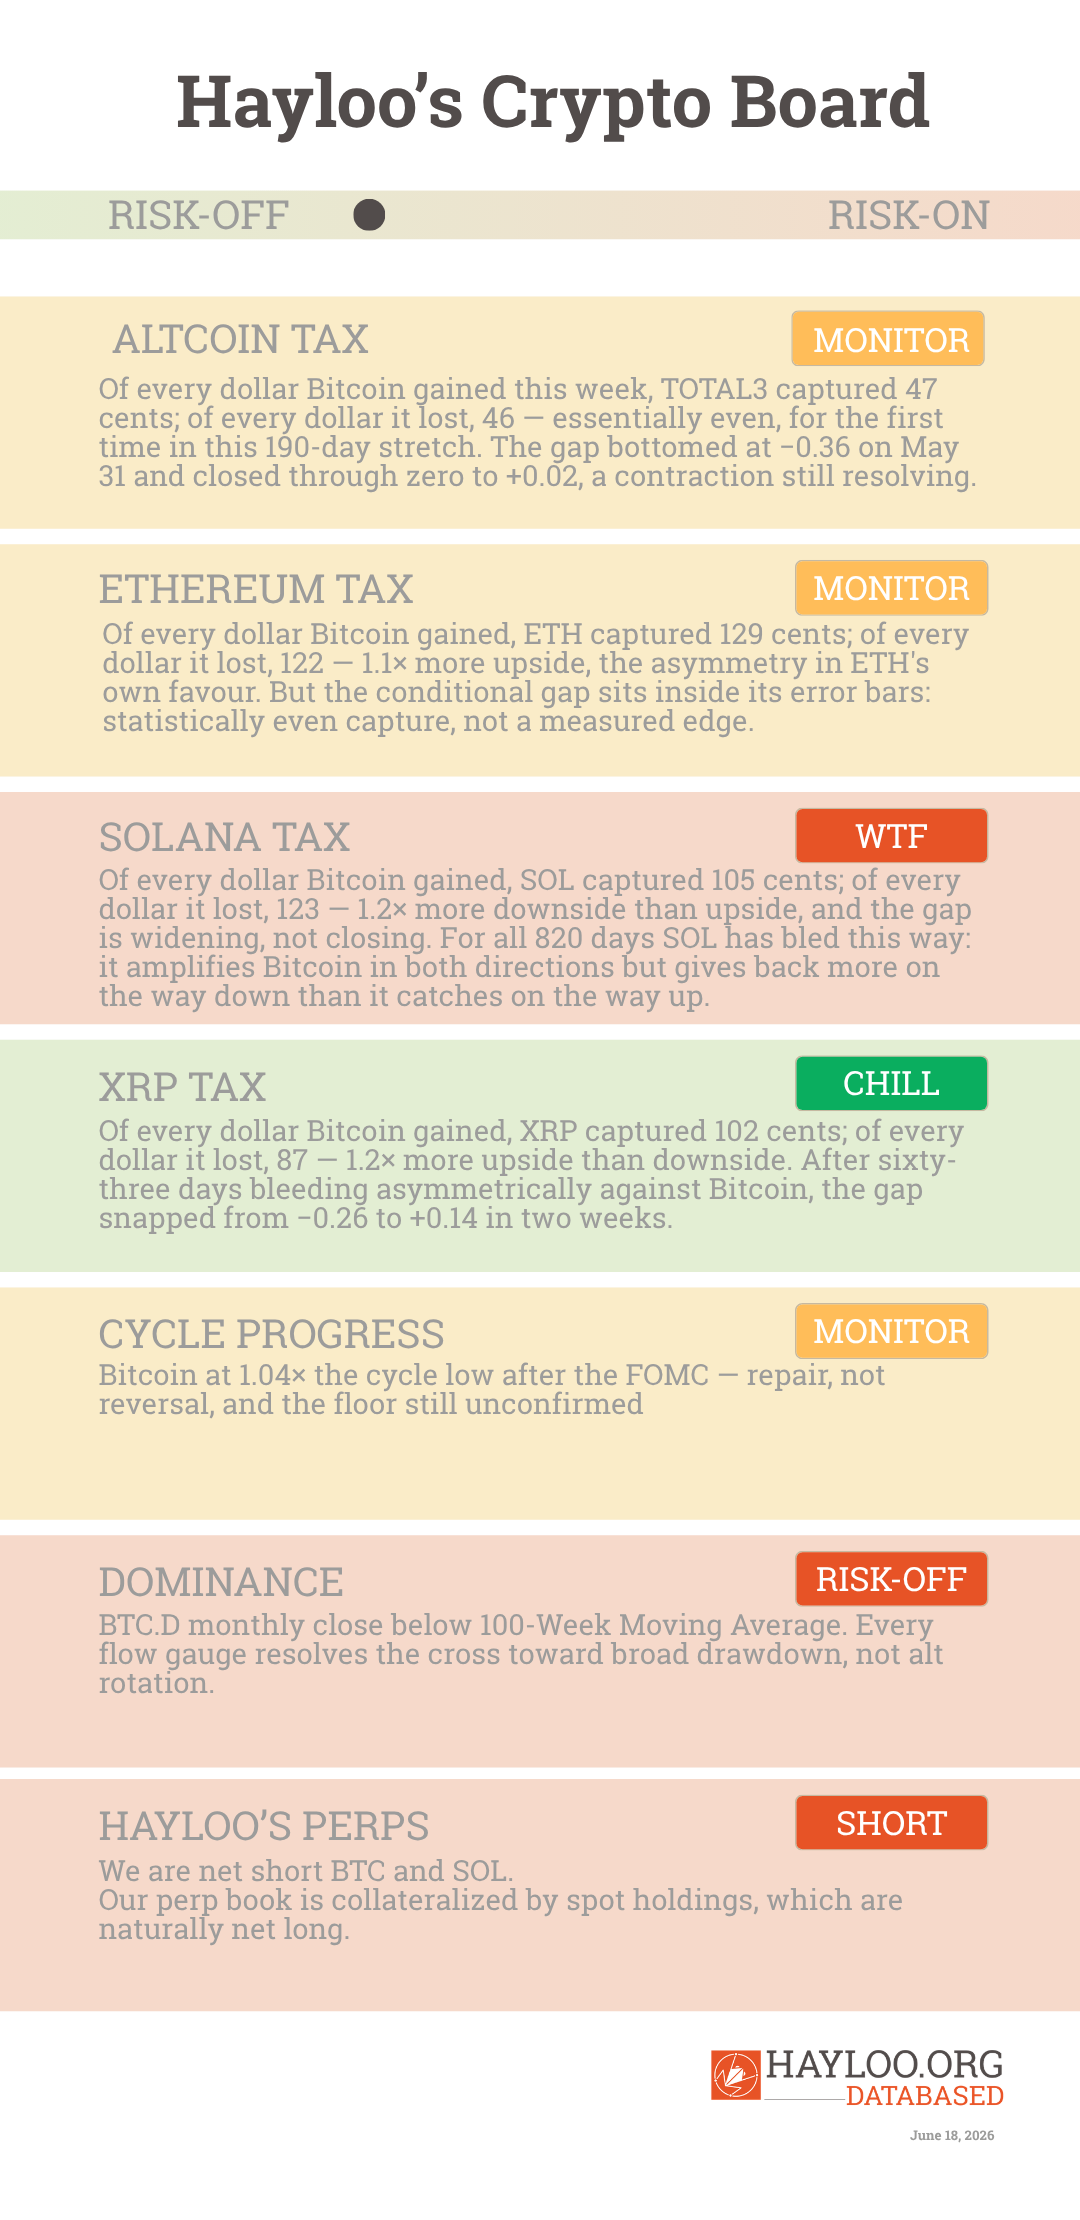
Of every dollar Bitcoin gained this week, the basket captured 47 cents; of every dollar it lost, 46 — essentially even, for the first time in this 190-day stretch. The asymmetry gap bottomed at −0.36 on May 31 and closed through zero to +0.02, choppily: a contraction still resolving, not a finished turn.
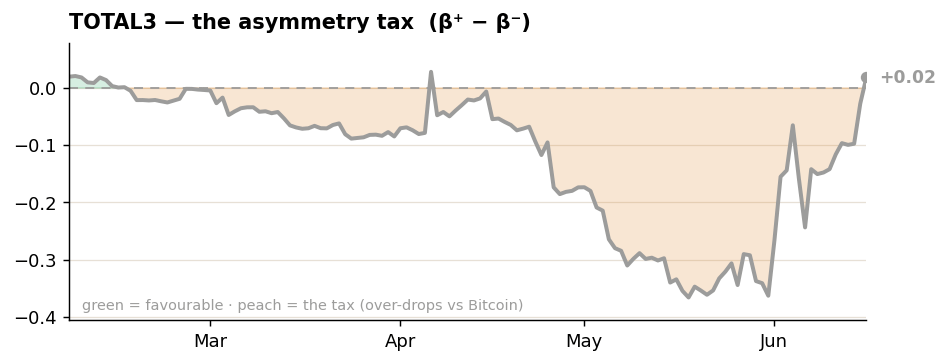
At 0.57 the 60-day beta sits mid-Trailing, below the regime’s 0.73 centre, a third of the way up the band with no boundary close and all three windows agreeing. Persistence is 190 days, well past the 51-day median run for Trailing — a long stay, and part of why stability reads unstable. The contraction flag fired a third straight week and reached its terminus as the gap crossed zero — the signature the backtest watches before a regime turns, in either direction. It does not call which.
XRP — back across the line
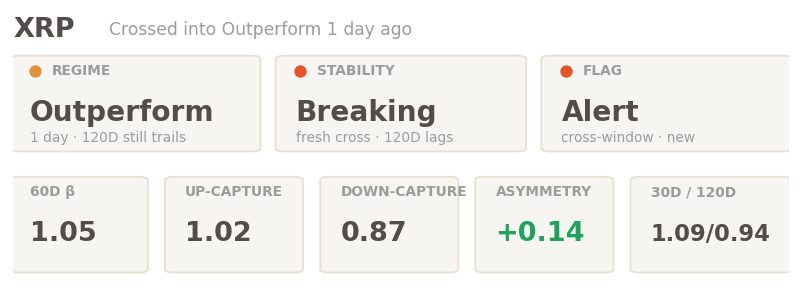
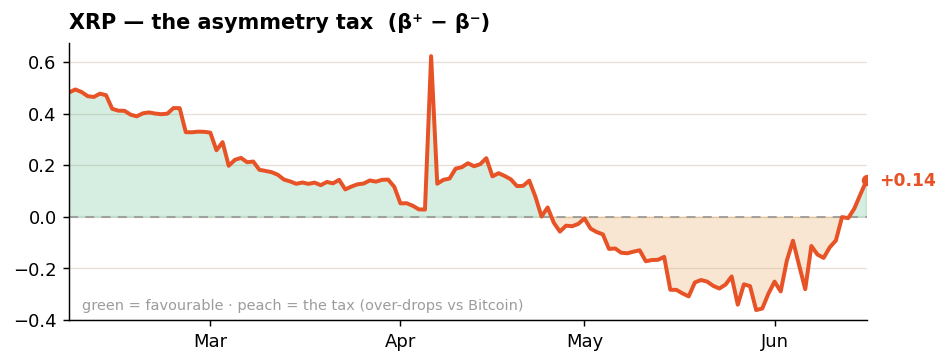
Of every dollar Bitcoin gained, XRP captured 102 cents; of every dollar it lost, 87 — 1.2× more upside than downside. After sixty-three days bleeding asymmetrically against Bitcoin, XRP’s gap snapped from −0.26 to +0.14 in two weeks.
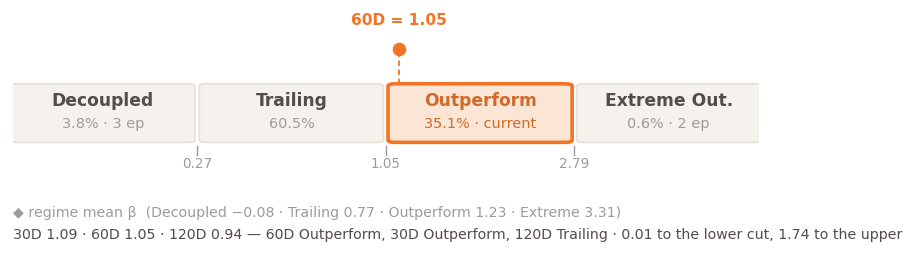
At 1.05 the 60-day beta sits just across its 1.05 Trailing cut — one day into Outperform after two months below. The 30-day agrees; the 120-day still reads Trailing, lagging behind. The cross-window split and the two-week asymmetry snap fire the flag, and the fresh crossing with the windows straddling the boundary is why stability reads breaking: a one-day-old lead on a noisy up-day sample, not a settled regime.
ETH — settled, barely
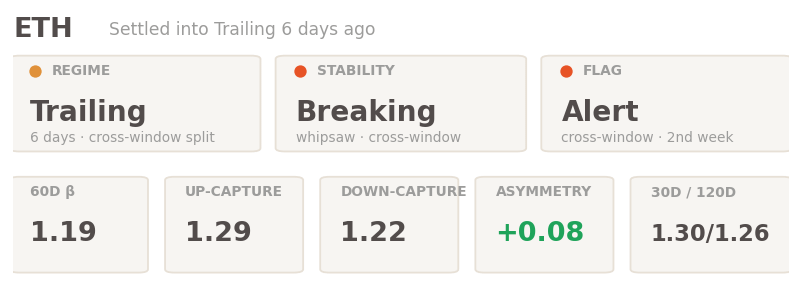
Of every dollar Bitcoin gained, ETH captured 129 cents; of every dollar it lost, 122 — 1.1× more upside, the asymmetry in ETH’s own favour. But the conditional gap sits inside its error bars: statistically even capture, not a measured edge.
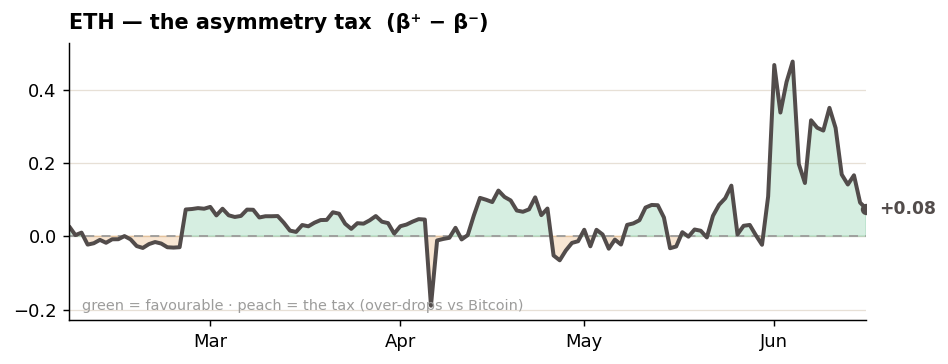
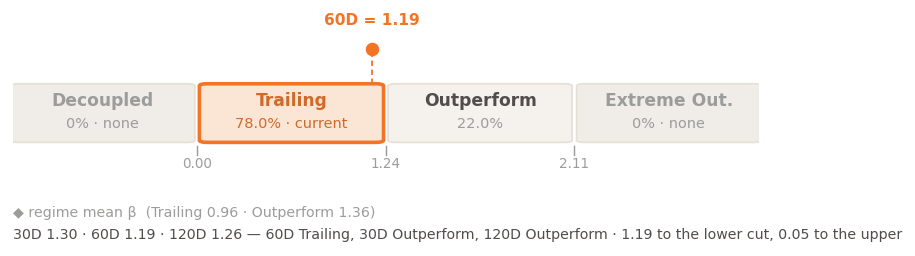
At 1.19 the 60-day beta sits at the very top of Trailing, 0.05 below its 1.24 Outperform line, after crossing that line four times the week before. ETH is sitting on its line.
◆ FOCUS THIS WEEK
SOL — the record run shows its first crack
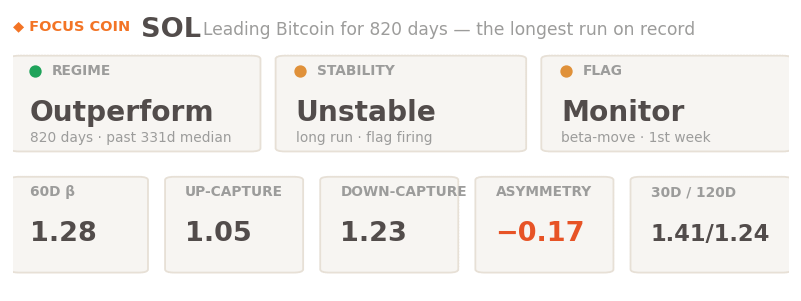
SOL has led Bitcoin for 820 days — the longest Outperform run in the entire dataset, past the prior record of 808 and 2.5× the regime’s 331-day median run. This is the first week the instability flag has fired inside that run: it trips on the movement condition, the 60-day beta jumping 0.16 over twenty trading days — from 1.12 to 1.28 — repricing fast even as the regime itself holds Outperform. Of every dollar Bitcoin gained, SOL captured 105 cents; of every dollar it lost, 123 — 1.2× more downside than upside, and the gap is widening, not closing. For all 820 days SOL has bled this way — it amplifies Bitcoin in both directions but gives back more on the way down than it catches on the way up.
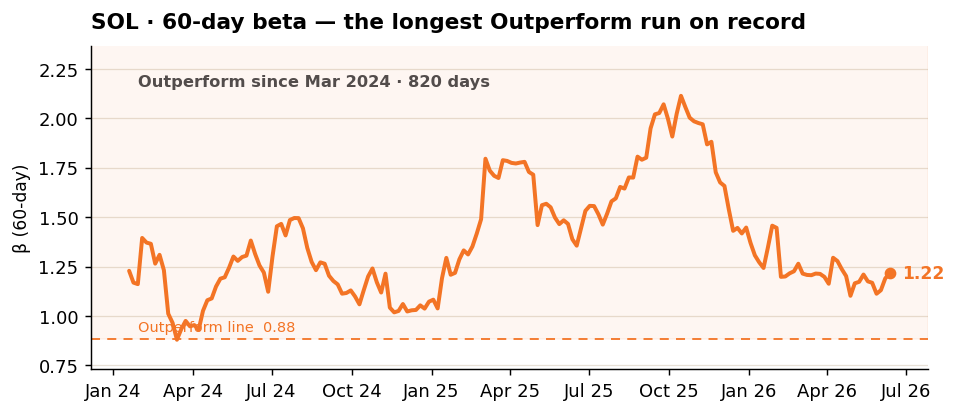
At 1.28 the 60-day beta sits in Outperform — the regime that holds 88% of SOL’s entire history — a third of the way up the band, 0.39 above the Trailing cut and 0.94 below the Extreme line. All three windows agree: 30-, 60-, and 120-day all read Outperform. SOL is a high-beta name that rarely trails Bitcoin. The first flag in the whole run is the first measured sign the relationship is repricing — the rare states, at the extremes, are where this desk watches hardest.
What’s solid, what’s soft. The 60-day betas and the regime reads are firm. The up- and down-captures rest on thinner samples, so this week’s asymmetry flips are one week old, not established, and SOL’s instability flag is its first — a watch. The Bitcoin relationships are moving fast right now; any read more than about three weeks out is on shaky ground. The Beta Desk measures the tape; it does not forecast direction.
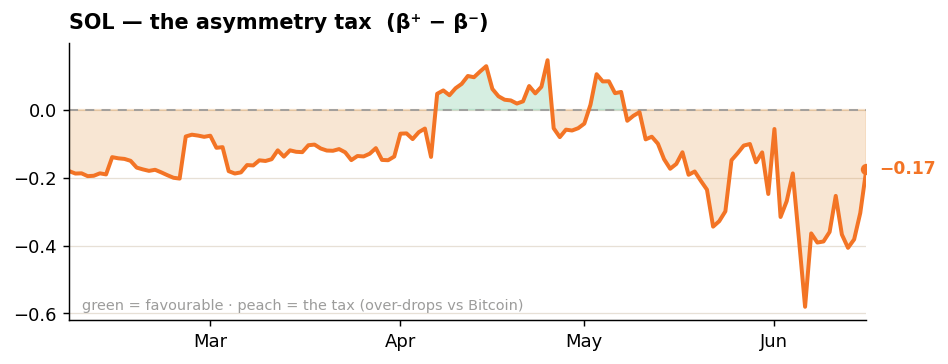
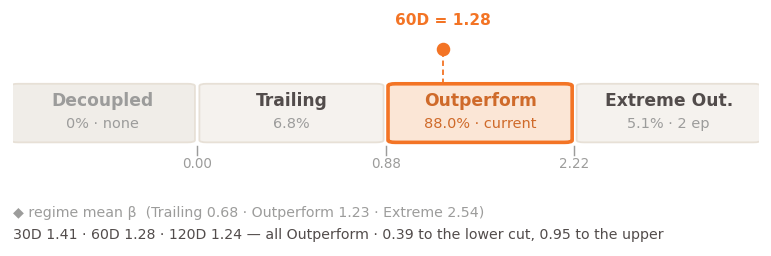
🟠 This week’s Beta Desk read: the four scattered into three regimes, every fresh crossing one week old and every stability flag firing — watch, not turn.
Hayloo Unchained · The Beta Desk
Hayloo’s Perp Book
Size and direction. Our perp book remains net short and unchanged: roughly 202 BTC short net and 36,720 SOL short net. Through the week the book bled, down 12.98%, all of it mark-to-market on the net-short legs against the risk-on bounce — then the hawkish FOMC drove Bitcoin to $62,522 and Solana to $68.55, and our account equity rose 10.67% in a single session. We took roughly $889,000 back in a day on the move the short positioning is built to fade.
Funding Rate Carry — income on composition, with a first positive print. The trailing-four-week mean funding carry runs +4.34% of equity.
Next levels that fire. Downside: $55,000 Bitcoin and $55 Solana, both Long Add / Short Take-Profit. Upside: a weekly close above the $77,200 True Market Mean with spot demand attached.
Position vs. thesis. The book is positioned for a bear-continuation, and the week resolved toward it. The de-escalation removed a tail risk and the FOMC castrated the catalyst. The five conditions in the Forward Thesis below govern it.
— Lead Trader (Jordi Federer)
🔴 Hayloo’s perp book is net short.
Forward Thesis
The next four to twelve weeks read lower-to-choppy, with the deepest price-headwind window in late August — late May’s Shadow Monetary Base trough plus Howell’s roughly 13-week transmission lag, a window the base-effect improvement does not move.
Warsh’s FOMC made the liquidity read actionable: a Fed signaling higher-for-longer is the mechanism by which a liquidity cycle past its peak transmits to asset prices, and crypto’s drop on the print is the first installment.
The first decision on a second leg down is $55,000 Bitcoin, bracketed by the $53,900 Realized Price and the $61,000 200-week moving average.
What would change our mind, each against its current value:
Shadow Monetary Base three-month annualized clearly positive on the next print — not a base effect. Now +2.7% but explicitly base-effect-driven with the 12-month rate slowing to 0.8%; not approached.
Realized Profit/Loss Ratio (RPLR) sustained above 2.0 across multiple weeks. Now a 30-day average of 0.53 and a 90-day of 1.10; far below.
A clean weekly close above $77,200 with sustained spot demand, including Coinbase order flow joining Binance in the bid.
ETF inflows of 1.5 billion a week for two consecutive weeks. The week netted a−465 million outflow and the funds swung back to roughly $82 million out on the FOMC; this relax-side crack-watch is moving away from relaxing, not toward it.
Ten consecutive S&P 500 closes below the 20-day moving average. This one fires toward escalation, not relief.
If two of these appear at once, we re-evaluate our book.
— Lead Trader (Jordi Federer)
Watchlist
BTC at $77,200 — True Market Mean
BTC at $53,900 — Realized Price
BTC at $61,000 — 200-week moving average
ETF flow magnitude and breadth — the funds swung back to outflow on the FOMC; Coinbase Cumulative Volume Delta (CVD) joining Binance in the bid is the contra-thesis confirmation. Two weeks of $1.5 billion-plus net inflows forces re-evaluation.
Howell’s SMB next print and the MOVE index — a clearly-positive, non-base-effect SMB resets the macro read; a MOVE re-spike above 80 sustained, against 70.66 now after the FOMC tick, reverses the multiplier expansion carrying the headline liquidity number.
WTI, the S&P 20-day average, and the new repatriation texture — the dollar is pulling capital home as central banks tighten through peace.
BTC.D — dominance below the 100-week moving average is a regime that still needs directional input.
The Hayloo Unchained Team
Chief Macro Strategist — Theodore Brennan. Macroeconomic cycles, central bank policy, growth and recession dynamics, sovereign debt, currency regimes. Flags regime shifts as they materialize.
Geopolitical Intelligence Officer — Margaux Lindqvist. Geopolitical risk, capital flow implications of conflict and alliance shifts, sanctions, resource competition, regime stability. Maps geopolitical events to capital flow implications.
Hard Asset Strategist — Marcus Vasquez. Responsible for identifying dollar-devaluation mispricing. Surfaces gold-denominated reads when the dollar regime shows signs of inflection.
Inflation & Real Asset Analyst — Sienna Whitfield. Assets priced against inflation. CPI, PPI, breakevens, real yields, commodity structures. Flags when nominal gains are real losses. Ensures harvest decisions are evaluated against real returns, not nominal.
Global Liquidity Director — Julian Harlow. Liquidity cycles, central bank balance sheets, cross-border credit creation. Anchors the team’s months-to-years time horizon.
Capital Flow Analyst — Priya Sandoval. Cross-asset flows, fund positioning, ETF mechanics, derivatives positioning, futures term structure. Tracks where new liquidity routes, surfaces flow shifts that contradict the standing synthesis.
Technical Analyst — Lukas Marchetti. Price action, structure, and pattern — calibrated to match the liquidity cycle timeframe. Technicals are treated as lagging confirmation of forward-looking signals. Divergence between technicals and macro thesis is expected and discussed, not resolved by hierarchy.
Fundamental Research Analyst — Charlotte Donovan. Asset-level fundamentals, network economics, supply dynamics, miner behavior, adoption curves. Tracks supply-side dynamics — LTH/STH cohorts, miner state, on-chain cost-basis structure.
Lead Trader — Jordi Federer. Domain: the book itself — capital allocation across perp positions and the spot collateral reserve; entry, harvest, and restructure calls; risk tolerance and conviction-sizing at execution. Hayloo is unchained by him.
The information is provided for information purposes only and on the basis that it will not be relied upon. No information contained herein constitutes a personal recommendation or investment advice.
The information (including any expressions of opinion or forecast) has been obtained from, or is based on, sources believed by the author to be reliable, but are not guaranteed as to their accuracy or completeness and should not be relied upon. The information is provided without obligation on the part of the author and on the understanding that any person who acts upon it or changes his investment position in reliance on it does so entirely at his own risk. The information does not constitute an offer to buy or sell or an invitation to make an offer to buy or sell any financial instrument.
Information is current only as at the date it is first posted and may no longer be true or complete when viewed by you. All information may be changed or amended without prior notice.
No representation, warranty or undertaking is given as to the accuracy or completeness of the information by the author and no liability is accepted by the author for the accuracy or completeness of such information. In no event will the author be liable to any person for any direct, indirect, special, or consequential damages arising out of any use of the information, including, without limitation, any lost profits.
You should be aware that the Internet is not a completely reliable transmission medium. The author does not accept any liability for any data transmission errors such as data loss or damage or alteration of any kind, including, but not limited to any direct, indirect or consequential damage, arising out of the use of the product or services referred to herein.
The materials provided here including text, photographs and other images, are protected by copyright and/or other intellectual property rights. All copyright (and any other intellectual property rights) in these materials is either owned by the author, or is used by the author under licence.