


Tape of the Week
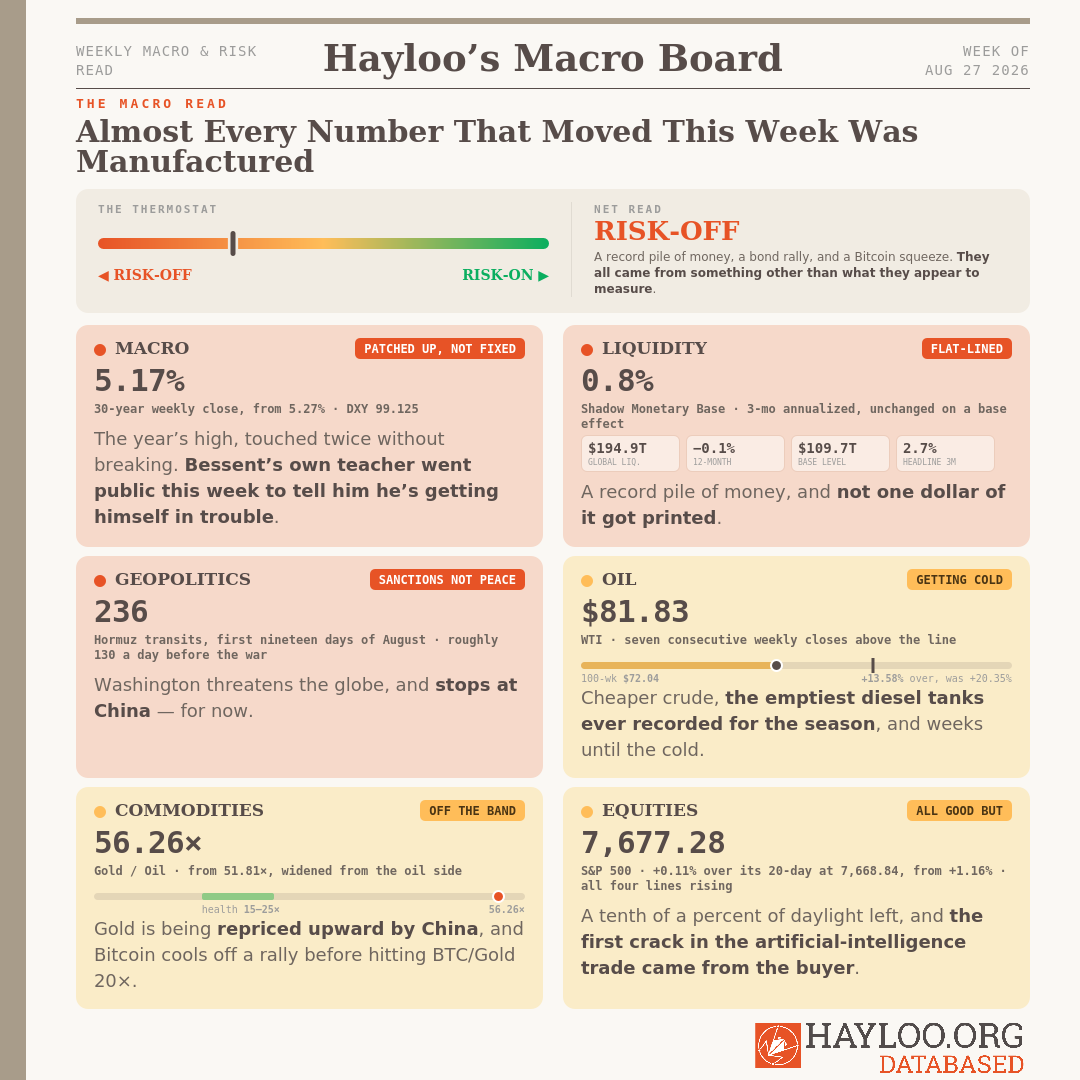
Global liquidity, according to Michael Howell’s GLI, hit $194.9 trillion this week, the largest pile of money ever assembled, and nobody created any of it. The engine underneath it grew at −0.1% over twelve months. What lifted the headline was a bond market so quiet that lenders now accept less collateral against the same loan, which lets every dollar already in the system be borrowed against harder. That ratio is the collateral multiplier, it sits at 1.78, and it is the closest thing this week had to a printing press.
The bond market was quiet because it was bought. On August 19 the Treasury doubled its buyback cap to $4 billion and aimed the money at the long end. Then Stanley Druckenmiller, who taught Scott Bessent how to trade, took the argument to the Wall Street Journal and named the operation for what it is. A government managing the price of its own debt, and filing it as liquidity work.
Bitcoin ran on the same kind of fuel. The move began on August 19 with the biggest dollar day of short liquidations since 2019, which is a rally made of sellers rather than buyers. Real money did follow, $2.23 billion of it across seven sessions, and all six Bitcoin wallet cohorts have been accumulating for twenty days. Underneath that, long-term holders posted the largest realized loss of the run. The oldest money on the chain used the strength to leave.
So the week handed us a record, a rally, and a re-rating, and not one of the three was paid for with new money. The one figure nobody engineered sits 5% overhead of current spot Bitcoin: 1.05 million coins bought between $83,000 and $86,000 that have not moved through the entire drawdown. Bitcoin came into this range in January, failed at the top of it in May, and is back at that top now with nothing underneath it changed. We doubled the short into that local top and took both hedges off.
On our use of AI:
We’re a private crypto fund out of Switzerland. We built a Neurosymbolic Compound AI System for our own desk: it follows our strategies, it reads the news that affect our portfolio for us, it sits on a database going back decades, and brings math to our everyday emotions. We call it Hayloo. It’s our best hire. This Substack is compiled by Hayloo, and written by us.
Humans have written machine-assisted for centuries. What never changes is who decides.
Nothing at Hayloo INC. was ever decided by a machine.
What we publish, is what we defend as a team. When it’s wrong, it’s wrong because humans signed it.
Jordi Federer, Founder, Hayloo INC.
Liquidity Tape
Global liquidity is at an all-time high and the creation rate is zero. That is this week’s read.
Michael Howell’s Global Liquidity Index flashed $194.9 trillion, the largest pile of money the world has ever assembled. Near-term momentum slipped to 2.7% annualized. The annual rate stabilized at 6.2%, which sounds respectable until you remember that stabilized is what a number does when it has stopped going anywhere, while rates and inflation move.
The Shadow Monetary Base is central bank liquidity plus the collateral the system borrows against, the foundation the whole $194.9 trillion stands on. It printed $109.7 trillion, a hair above last week’s revised $109.6 trillion. Its three-month rate remained at 0.8%, and the annual rate is −0.1%, which confirms that the underlying liquidity creation has stalled. Twelve months of work by the five largest central banks on earth, and the foundation is fractionally smaller than when they started.
Follow the money, and you will find that bond volatility is low, very low. This means lenders demand less collateral against the same loan. Smaller haircuts mean every dollar of collateral carries more borrowing on its back. That ratio is the collateral multiplier and it sits at 1.78. So a slice of the money holding that record headline liquidity up was never created by anybody. It was manufactured by a quiet bond market letting the same collateral be borrowed against harder, which is exactly what an annual rate of −0.1% says from the other side.
🔴 The biggest number in history, resting on a bond market that has been told to sit still.
— Global Liquidity Director (Julian Harlow)
Macro Tape
The Treasury has become the marginal buyer at the long end, and this week that worked.
The thirty-year came in to 5.17% on the weekly close from 5.27%. That 5.27% is the high of the past year, and the market has now put its shoulder to it twice without getting through. What moved it back was not a change of heart about American debt. On August 19 the Treasury doubled the cap on its buyback operations, from $2 billion to $4 billion, and pointed the money at the long end.
Then on the 25th, Stanley Druckenmiller, who taught Scott Bessent how to trade, took the argument to the Wall Street Journal editorial page under the title “Let the Bond Market Speak.” His charge is not that the buying fails. It is that the buying is a fraud on the tape. The Treasury is managing the price of its own debt and filing it as liquidity work, and in doing so it is jamming the most important price signal in global finance. Drop the buybacks, Druckenmiller says, and shrink the primary deficit, because that is the only repair that holds. A thirty-year clearing at 5.5% is not an insult Bessent can talk down. It is an invoice, for a subscription, and just like your Netflix bill, it keeps coming back.
The July inflation print gave everyone room to argue. Core PCE rose 0.2% on the month and 3.3% on the year. Headline came in at 3.7% against a 3.6% forecast. Real spending was flat.
The Bank of Japan’s Ryozo Himino backed continued rate rises with the policy rate already at a thirty-one-year high, and in the same week the Finance Ministry said it will seek a record ¥36.6 trillion to service the debt. The rate rise that steadies the yen impacts the budget. Tokyo can’t have both at once. In Frankfurt, Isabel Schnabel said rates must rise further and tied the euro-area path explicitly to energy prices, which quietly makes the Strait of Hormuz a European Central Bank (ECB) variable.
🟠 The long end came in on a bid the Treasury doubled itself, and the man who trained the buyer went public to tell him to stop.
— Chief Macro Strategist (Theodore Brennan)
Geopolitical Tape
Kpler counted 236 crossings of Hormuz in the first nineteen days of August. Before the war, that lane ran roughly 130 a day.
Washington made five Iranian sectors sanctionable and stopped short of the Chinese banks that clear the oil money. Tehran priced that inside the hour and so did crude.
Beijing has been told it is exposed and has answered that it is not moving, which leaves the next escalation resting on a question nobody wants to hear: do some folks in Washington actually want a war with China?
🔴 Count hulls, not announcements: the traffic that matters is standing still.
— Geopolitical Intelligence Officer (Margaux Lindqvist)
Commodity Tape
Seven consecutive completed weekly WTI closes above the 100-week line, and the line itself is rising.
American diesel supplies are at the lowest seasonal level ever recorded, and Europe reached all the way to Mexico for cargoes for the first time in seven years. A cheaper barrel does not fix a shortage of refining capacity, and heating season starts shortly in the northern hemisphere.
Our desk splits on which half is the signal. We read the pillar reloading from the refinery. The geopolitical desk reads the barrel side genuinely loosening, with Gulf neighbors filling the gap and the war premium bleeding out on flows nobody had to negotiate. What settles it is a fortnight of transit counts, supplies at normal levels, and not another truth or dare.
🔴 The barrel loosened and the diesel tank didn’t. One of those two reaches your heating bill.
— Inflation & Real Asset Analyst (Sienna Whitfield)
Hard Assets
Gold sits at $4,604, 4.90% above its 20-week line, enabled by renewed People’s Bank of China liquidity injections.
The Bank of Russia cut its gold holdings to a six-year low, selling the reserve asset into strength. That is not a new Russian view on gold, it is a funding decision: a country that needs cash borrows it. A country that desperately needs cash borrows it at any price. And a country that is isolated sells the reserve asset.
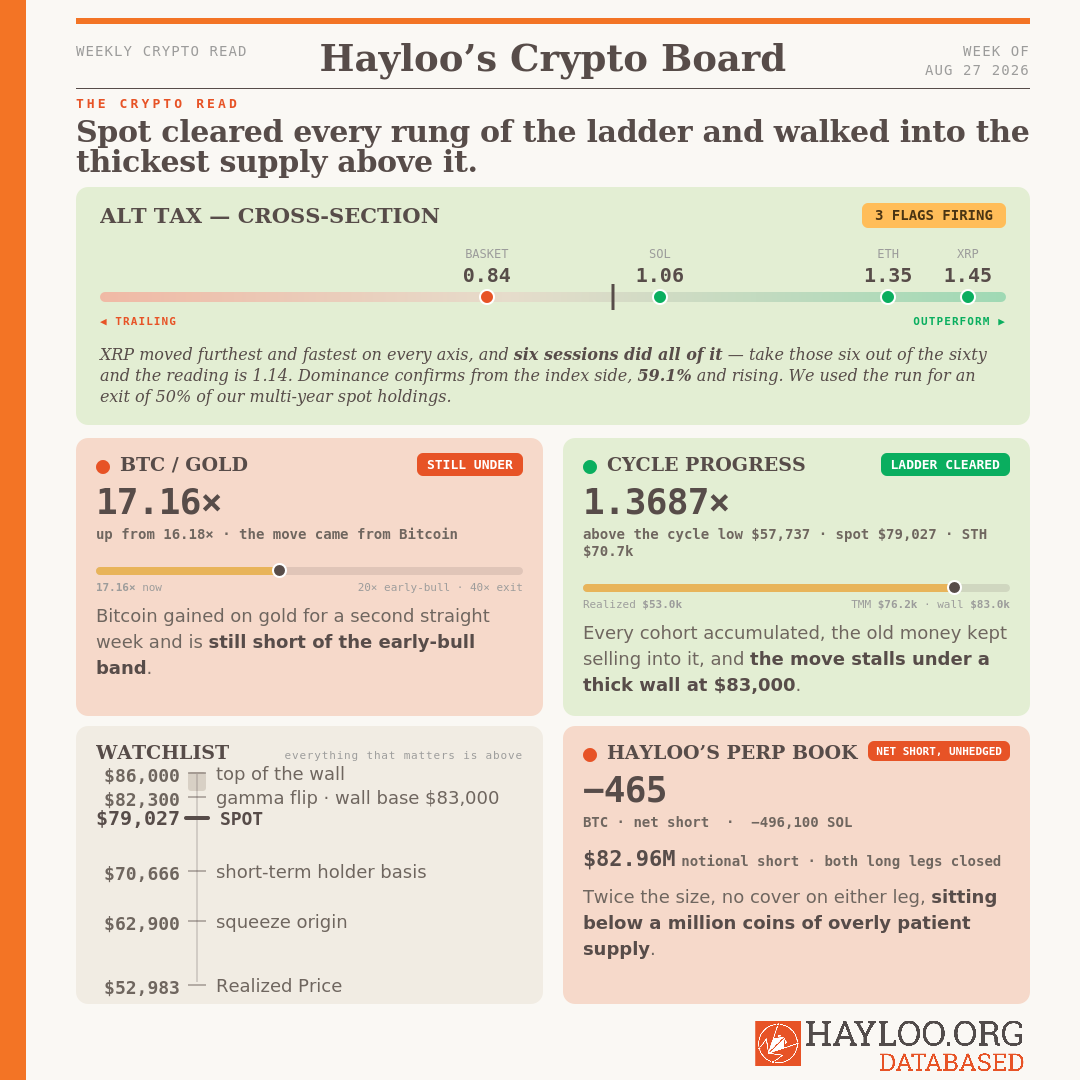
BTC/Gold rose to 17.16× from 16.18×, all of it from Bitcoin’s attempt at closing the week above, and standing on an $80,000 floor. It is still under the 20× early-bull band, but the gap narrowed. Gold/Oil widened to 56.26× from 51.81×, and that one is the barrel’s doing.
🟠 Russia sold gold into a strong tape, which says a lot about Russia and little about gold.
— Hard Asset Strategist (Marcus Vasquez)
Equity Tape
The S&P sits on its 20-day line at 7,730.84, closing on a cushion it held through the AI hype. The index is still above its 20-week line, and all four structural lines are still rising, but the slopes flattened across the week. Nothing has broken. But there is almost no daylight left between the index and the first line that will fire the flags at overleveraged positions.
Nvidia was this week’s story, reporting $96.2 billion against $92.27 billion and guiding to $108 billion against $103.9 billion, with margin guided down to 74%.
On the same morning, Australian businesses cut June-quarter investment, and data-center spending sat at the heart of the slowdown. Australia is far away for most people on the globe, and one country is not a trend.
But the signal we read is that while the supplier beat expectations, the buyer expresses caution. Weakness on the side writing the checks always travels to the side cashing them.
🟠 A tenth of a percent of daylight, and the first weak print came from the customer rather than the supplier.
— Technical Analyst (Lukas Marchetti)
1 Million Coins Sit Between Bitcoin and a Breakout – Hayloo’s Crypto Board Week 35
Real money flowed into Bitcoin this week, and the move still stopped at the wall we pointed at for weeks.
On-Chain Tape
The buyer changed mid-move, and that is the part that matters.
The first half of Bitcoin’s miraculous rise from the ashes was shorts being run over into a squeeze. August 19 was the biggest dollar day of short liquidations since 2019.
The second half was real money flowing in: $2.23 billion of exchange-traded fund (ETF) inflows, the strongest seven-day intake of the year. Futures open interest fell 11% in coin terms over the same window and funding barely left neutral, so there was no crowded short base going in and no leveraged long chasing it out.
Glassnode’s accumulation measure has held for all six wallet cohorts across twenty days since August 5, the most persistent all-cohort buying since late 2024. The realized profit-loss ratio reads 3.115 and has printed above 2.0 on six consecutive days, five of them above 3.0, after a fortnight that sat under 1.0.
Long-term-holder realized loss on a thirty-day average made a run high at $355.8 million. Old money is still leaving into strength.
The wall above is the one we’ve pointed at for weeks: $83,000 to $86,000 is the level of 1.05 million coins that sat through the entire drawdown. Below, the $62,000 to $65,000 band holds 1.44 million coins, many of them short-term holders defending recent entries.
This on-chain read bids for patience. Bitcoin came into this range in January and has not closed above the top of it since. It tried in May and failed there. It is back at that same top now, and nothing underneath it has changed. We doubt that the current landscape warrants a breach to the upside.
🟠 This week’s price action was real money flowing in. But it still has to get through a wall of 1.05 million coins to prove a breakout.
— Capital Flow Analyst (Priya Sandoval) · Fundamental Research Analyst (Charlotte Donovan)
XRP and SOL Ran to the Top and We Sold – Hayloo’s Altcoin Tax Week 35

Beta is one number: when Bitcoin moves a dollar, how much does this coin move. Above one it amplifies Bitcoin’s gains, below one it lags. We measure beta over sixty days and then twice more, once on …
Hayloo’s Perp Book
Size and direction. Net short Bitcoin and Solana, and no longer hedged on either. Bitcoin: 465 coins short at $78,749.00, long leg closed. Solana: 496,100 coins short at a blended $93.42, long leg closed. Net notional across the book is $82,963,947 short.
Solana ETFs rose to a record cumulative Total Net Inflow of $1.32B, front-running three validator proposals, two of them aimed squarely at the supply. All three passed, and the outcome was never in doubt. Rumor buyers now run into a wall of news sellers, and they are paying steep funding to stand there.
We closed the long hedge and rolled into the short leg, banking roughly $500,000, a 112% profit on a position held since June.
With the Solana vote behind us, Bitcoin sets the pace from here. And Bitcoin has gone nowhere for seven days. We’re short both legs.
Position versus thesis. The thesis is intact and the foundation under it got firmer. What changed is the exposure. We are at the top of a multi-month range, we doubt any liquidity will reach Bitcoin anytime soon, and we doubt that the equity tape supports it any further.
That last one is mechanical, and it is worth walking slowly. Equities are slowing down. The institutional book that holds Bitcoin against a fixed allocation band suddenly finds Bitcoin too large a share of a smaller portfolio. Nobody at those desks decides anything. The rule sells Bitcoin. And it sells into a band already holding 1.05 million coins of long-term-holder supply, with a short-liquidation shelf running all the way to $86,000.
We have been pointing at that wall for weeks. Here we are, and our money is on the wall, not on Bitcoin.
— Lead Trader (Jordi Federer)
🔴 Short, twice the size, both hedges off. Our money is on the wall, and not on Bitcoin.
Forward Thesis
Our direction is unchanged over the next four to twelve weeks and the foundation under it is stronger than it was seven days ago. Global Liquidity Index (GLI) weakness from the late-May trough lands in financial markets now, followed by an even deeper window in early November, and nothing points up yet.
Our short book filled up through a move where all six wallet cohorts have been accumulating for twenty days. We buy weakness and sell strength, so twenty days of everyone buying is our signal to be on the other side. That’s how we trade perps at Hayloo.
We’ve also cut our XRP spot exposure in half. We’re rebuilding the spot book for a market that adopts the technology fast and usually skips the coin that runs on it.
What would change our mind, each against its current value.
1. Liquidity inflows clearly positive without a base effect, with the annual leg back above zero. Now 0.8%, with the base effect named by Michael Howell of Capital Wars, and the annual leg at −0.1%. Further away than at any point in this window.
2. A Bitcoin close beyond $83,300 with inflows holding, which would absorb the wall rather than respect it.
3. The profit-loss ratio holding above 2.0 through a pullback, with cohort accumulation intact. Now 3.115, six prints deep. We flag this, and look at the pullback.
Watchlist
The shelf, the flip, and the wall: $80,800, $82,300, $83,000 to $86,000.
Open interest rebuilding alongside rising funding.
The thirty-year against 5.27%. The year’s ceiling, touched twice without breaking, and the level that decides whether the Treasury’s bid is a floor or a subscription.
The Team
Jordi Federer — Lead Trader. Owns the book and the publication. Sizing, staging, and every decision that moves capital.
Theodore Brennan — Chief Macro Strategist. Central-bank reaction functions, the dollar, and the rate path.
Julian Harlow — Global Liquidity Director. The liquidity engine, the collateral multiplier, and the transmission lag into price.
Margaux Lindqvist — Geopolitical Intelligence Officer. State behavior, escalation mechanics, and the tails that reprice commodities.
Marcus Vasquez — Hard Asset Strategist. Gold, the debasement basket, and the hard-money ratios.
Sienna Whitfield — Inflation & Real Asset Analyst. Energy, the inflation impulse, and the real-asset complex.
Priya Sandoval — Capital Flow Analyst. Fund flows, positioning, derivatives, and where the marginal dollar comes from.
Charlotte Donovan — Fundamental Research Analyst. On-chain cohorts, cost bases, and the structural read beneath the tape.
Lukas Marchetti — Technical Analyst. Market structure, moving-average regimes, and the levels that fire.
Disclaimer
The information is provided for information purposes only and on the basis that it will not be relied upon. No information contained herein constitutes a personal recommendation or investment advice.
The information (including any expressions of opinion or forecast) has been obtained from, or is based on, sources believed by the author to be reliable, but are not guaranteed as to their accuracy or completeness and should not be relied upon. The information is provided without obligation on the part of the author and on the understanding that any person who acts upon it or changes his investment position in reliance on it does so entirely at his own risk. The information does not constitute an offer to buy or sell or an invitation to make an offer to buy or sell any financial instrument.
Information is current only as at the date it is first posted and may no longer be true or complete when viewed by you. All information may be changed or amended without prior notice.
No representation, warranty or undertaking is given as to the accuracy or completeness of the information by the author and no liability is accepted by the author for the accuracy or completeness of such information. In no event will the author be liable to any person for any direct, indirect, special, or consequential damages arising out of any use of the information, including, without limitation, any lost profits.
You should be aware that the Internet is not a completely reliable transmission medium. The author does not accept any liability for any data transmission errors such as data loss or damage or alteration of any kind, including, but not limited to any direct, indirect or consequential damage, arising out of the use of the product or services referred to herein.
The materials provided here including text, photographs and other images, are protected by copyright and/or other intellectual property rights. All copyright (and any other intellectual property rights) in these materials is either owned by the author, or is used by the author under licence.