


Tape of the Week
The S&P hit another record with consumer confidence near a decade low. Households trust that Elon Musk will hand them back their money a hundredfold, but they do not trust the currency of their own government. Underneath, the tape has gone quiet in a way that should not be mistaken for calm. Global liquidity is draining out of risk assets and into real stuff, and Bitcoin’s spot volume now reads like a minute of silence, everyone waiting for the first person to clap.
Bitcoin sellers are exhausted and half the supply is still in profit. Call that a recognisable bottoming zone. Those same readings were true in November 2018, three weeks before the market fell another fifty percent. The risk here is mechanical rather than emotional. The thing most likely to hit Bitcoin this quarter is not a Bitcoin event, and nobody who delivers it will have formed an opinion about Bitcoin. A spreadsheet will do the selling, into a bid a third thinner than the one that caught the last move.
Liquidity Tape
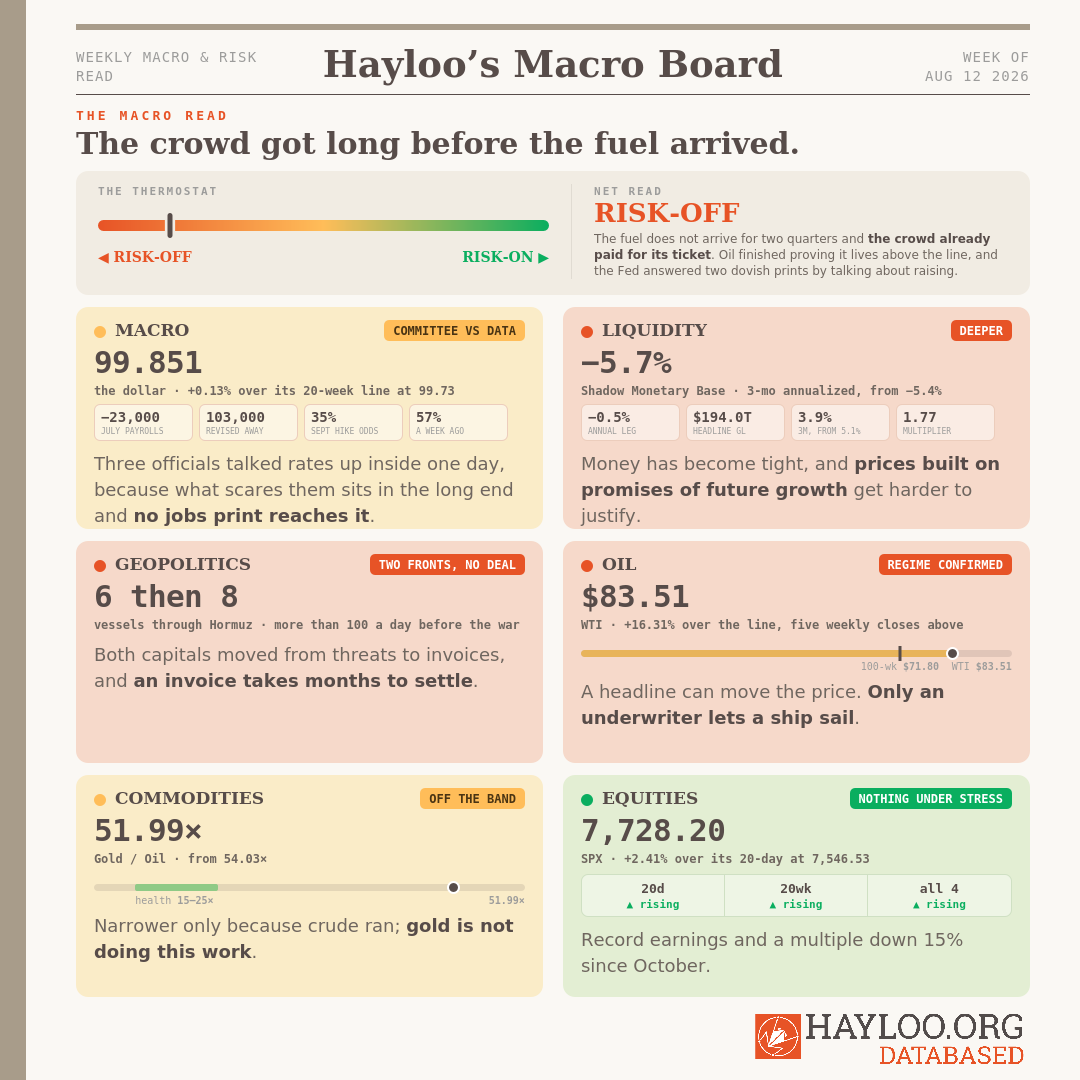
The money that funds markets shrank again, the fifth week running, and the fall got steeper. The Global Liquidity Index (GLI) Shadow Monetary Base is falling at a 5.7% annual pace over the last three months, from 5.4%.
With the Treasury arguably suppressing bond volatility on purpose, the collateral multiplier now prints 1.77. Quiet bonds mean smaller haircuts, so the same collateral carries more borrowing. Global liquidity is still growing on the back of that, at 3.9% over three months, inflation is running at 3.4%, so money is barely growing faster than prices.
In an ordinary economy that balance would be healthy. In markets leveraged to the teeth it is not enough to keep the music playing. Keep going down that alley and liquidity growth reaches zero in September. If the suppressed bond jitters unwind and the MOVE index of bond volatility climbs from the seventies back above eighty, the collateral multiplier runs backwards and takes a chunk of the world’s $194 trillion with it.
We have been short risk assets since January and here is why we hold a while longer. The Treasury is borrowing on very short terms, which keeps cash moving through the real economy, and the results show it: factory activity jumped to 55.6 from 53.3 and the Atlanta Fed sees 5.8% growth this quarter. The world’s biggest economy is running hot.
Meanwhile the Fed’s bond-buying programme, the thing that used to feed markets specifically, is down to about 40% of its peak. Overleveraged financial markets are at risk of reverting to their 200-week averages, as they did in 2022, when the S&P fell 25% and Bitcoin fell 75%.
Money has become tight, and prices built on promises of future growth get harder to justify. Investors have not accepted that yet. And that’s why we keep our short positions open a little longer.
🔴 The money that feeds the future is shrinking, while the present hums along just fine.
— Global Liquidity Director (Julian Harlow)
Hard Assets
Gold had its strongest week since January, and how it traded matters more than where it closed. It was bid while oil fell. The engine underneath is why we take it seriously. Michael Howell’s Capitalwars tracks the People’s Bank of China (PBoC) balance sheet against gold and finds: the tap went off in early March alongside the Iran crisis and gold fell. Injections restarted around the fragile peace memorandum.
🔴 This week’s hard-asset tape has gold running on Beijing’s balance sheet.
— Hard Asset Strategist (Marcus Vasquez)
Macro Tape
The data made the case for cutting rates twice in seven days, and the Fed spent the same week arguing back.
American employers cut 23,000 jobs in July against a forecast of 80,000 to 100,000 new ones, and the statistics bureau quietly removed another 103,000 from May and June. Then inflation came in at 3.4% from 3.5%, with the underlying rate easing to 2.5%. Traders read the pair and cut September hike odds to 35% from 57%.
Three Fed officials answered inside a single day and all three talked rates up, which sits oddly against a President demanding cuts while crafting inflation through oil wars, sanctions and tariffs. Those pull against each other.
Note what a rate above inflation actually does. Debt only melts when inflation runs hotter than the rate, and the inflation relief is thinner than it looks anyway. It covers July, before the strait tightened again, and the part that cooled was energy, the one line the ongoing war controls.
That’s why lenders charge America more, and they charge it in the long end where a weak jobs print cannot reach.
The bond market is the only participant of Trump’s presidency who cannot be fired or jawboned. The 30-year hit 5.23%, a nineteen-year high, and at that yield, buyers are showing up. It also melts every version of managing the American debt to pudding, which is why Japan’s ability to fund itself matters so much: As long as Japan does not need to sell American bonds, every asset on the board can breathe another day.
🟠 The bond market is the only player who cannot be fired, and it is charging America for Trump’s “truth”.
— Chief Macro Strategist (Theodore Brennan)
Commodity Tape
WTI sits 16.31% above its rising 100-week average, and the reopening trade that had been compressing that cushion collapsed because paying Tehran for passage breaches US sanctions and voids war cover under a Lloyd’s clause adopted on July 23. A headline can move the price of oil. Only an underwriter lets a ship sail. Transit ran six vessels on Monday and eight on Tuesday.
The supply picture underneath does not resolve when a strait opens. It resolves on two rebuilding timetables at once, the diplomatic one and the physical one, and the physical one is far slower. Every substitute for Hormuz is the long way round, through new pipelines and new tonnage. That is years of construction, not a news cycle.
A genuine truce could still take 20% off the price inside a week, and the structure underneath would not have moved an inch. The energy crisis ends when cheap energy flows again, not when Trump feints.
🔴 Five weekly closes above the line, and the constraint is now written into an insurance contract rather than a news cycle.
— Inflation & Real Asset Analyst (Sienna Whitfield)
Geopolitical Tape
Washington and Tehran now prefer arguing over money to spending it on ammunition. Trump wants compensation from Tehran and Tehran wants it from Washington. They will haggle over that for months, if not years.
Tokyo went around both of them and phoned Tehran directly to ask that its ships not be charged for passage. That call is the most informative thing in the week. Japan buys almost all its crude from the Gulf, nearly all of it through this strait, along with much of its gas, and it sits on one of the deepest emergency stockpiles in the world. So the buyer with the most at stake and the most time to spare has decided the mediators will not deliver, and has gone to negotiate its own exemption.
Which exposes America’s Achilles heel. The blockade binds people inside the dollar system and nobody else. China has been buying Iranian crude for years through small refiners paying in yuan, through banks with no American exposure, and nothing happening in the Gulf touches that trade. The oil moves. What is being decided is who gets to buy cheap energy.
That gives Japan’s call two possible follow-throughs. Either countries win carve-outs inside the existing system, or the Russian model spreads: non-Western insurers, non-Western banks, a separate fleet.
Safe passage gets rebuilt either way, because the people who need it to work will build it locally. A system built to route around a crisis outlives the crisis, and the customers it wins do not come back to the dollar once the shooting stops.
🔴 The week moved from bombs to invoices, and the buyers stopped waiting for the mediators.
— Geopolitical Intelligence Officer (Margaux Lindqvist)
Equity Tape
Nothing here is under stress at any horizon we measure. SPX sits above its 20-day and 20-week lines, all four trend lines rising, a fresh record on August 7.
What the tape carries is a rotation. Consumer confidence sits among the weakest readings of the past decade while the index prints records. Households are leaving cash for assets. They may trust Apple, or Elon Musk, or a fund that holds a little of everything. What they no longer trust is the currency their government is printing.
Bitcoin sat out that flight entirely, which is awkward for an asset built to catch it. The S&P-to-Bitcoin ratio crossed above its 200-week average for the first time. The earnings themselves came in strong, near 33% growth and one of the largest beats on record. What has weakened is the market’s willingness to pay for them, with the forward multiple down about 15% since October even as the index made new highs. Investors are handing the artificial-intelligence (AI) trade record profits and marking down what those profits are worth, because they are questioning chip-demand forecasts and the debt being taken on to meet them.
Nvidia is arranging a $500 billion financing pool with Apollo, Blackstone, BlackRock, Brookfield, Goldman Sachs and KKR, using their clients’ capital rather than its own balance sheet, to fund the customers who buy Nvidia chips. The stock fell on concerns about circular financing and how long the spending can last. Nvidia reports on August 26.
🟢 Every horizon we measure is still rising, and the scarce-asset bid walked past Bitcoin on its way to stocks.
— Technical Analyst (Lukas Marchetti)
Looking for the Alts That Thrive Without Clarity – Crypto Tape Week 33
On-Chain Tape
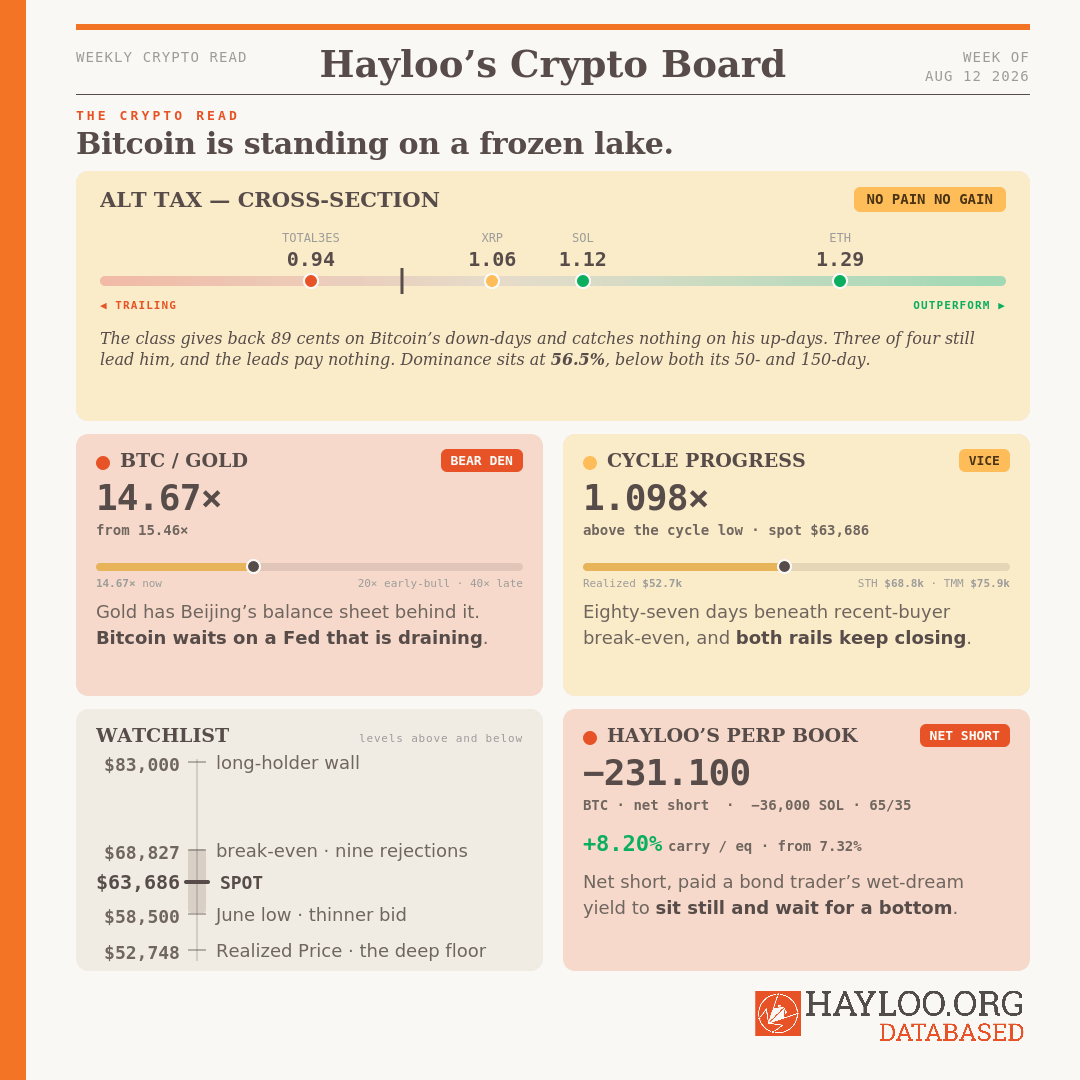
Price is wedged in a vice and both jaws are closing. Spot sits just above the median cost basis at $63,000 and below recent-buyer break-even at $68,827. It has spent nearly three months in that pocket, and barely half the circulating supply holds an unrealized profit.
The danger sits underneath. Futures open interest runs at 1.36 times a full day of futures volume. When open interest towers over daily volume, liquidations meet almost nothing to absorb them.
That is the floor a genuine accident would land on, and the route it would take has nothing to do with Bitcoin. A crack in the AI trade hits a leveraged multi-strategy book, gross exposure has to come down by more than the loss to hold the leverage ratio, and every sleeve gets cut regardless of what it did.
Bitcoin is the only position in that book that trades at three in the morning on a Sunday, so it is what sells when margin is needed before Tokyo opens.
Nobody in that chain forms an opinion about Bitcoin. A spreadsheet sells it. Institutional size arriving into a book this thin is why $58,500 is one floor, realized price at $52,748 is another. Bitcoin is standing on a frozen lake right now, and if the floor gets hot, prices melt.
Sellers are exhausted and half the supply is still in profit. Call that a recognisable bottoming zone. Those readings were also true in November 2018, three weeks before the market fell another fifty percent.
Bitcoin at $63,000 looks like a fair price to pay. A twenty percent wick is the ordinary cost of being early in this asset class. Our buy orders sit below $60,000.
🟠 The thinnest tape in seven years, facing a danger that has nothing to do with digital assets.
— Capital Flow Analyst (Priya Sandoval) · Fundamental Research Analyst (Charlotte Donovan)
The Alt Tax – Reshuffeling after CLARITY is unclear

Hayloo’s Beta Desk. Beta is how much a coin moves when Bitcoin moves a dollar: above 1.00 it amplifies Bitcoin, below 1.00 it lags. The desk splits that into what a coin catches on Bitcoin’s up-days …
Hayloo’s Perp Book
Size and direction. Hayloo’s book remains net short. Bitcoin: −231.100 coins net, an entry-net of −$16,205,413 and −$14,717,835 at mark. Solana: −36,000 coins net, −$2,052,162 entry-net and −$2,746,080 at mark. Equity reads $8,799,397, down 0.13% on the week, having traded to $8,439,200 on August 10 and recovered from there.
What we are watching inside that. We moved a large part of our spot collateral into stablecoins in August 2025, and the changes coming out of the current US administration have us restructuring that collateral rather than simply redeploying it.
The coins that live with permanent ambiguity rather than waiting to be rescued from Washington pique our interest, and we are taking deep dives into ONDO, XAUT, HYPE and LINK. The book has run hedged since January, sitting 65/35 short. Weakness is where the short legs get realized and the long legs get fed.
So Hayloo’s book stays where it was: net short, 65/35, hedged since January, paid 8.20% a year in funding by everyone who showed up too early to the bull market. The one change we are working toward is the Solana leg, and it is not a change of view. Solana now gives back 83 cents on Bitcoin’s down-days, its sixty-day beta is the lowest since June 3, and the gap between what it catches and what it loses has collapsed from a record 0.50 to 0.08. The amplifier stopped amplifying. We bank that one on weakness and keep the Bitcoin leg, collecting a yield most bond traders only dream about.
Funding rate carry — income, and it improved again. Our patience in holding the short rests on leveraged traders buying early. The trailing four-week smoothed mean of daily funding income reads +$1,977.63 a day, which annualizes to +$721,837 and 8.20% of equity, up from 7.32% a week ago. Both funding rates are positive against our net-short book, so both short legs collect while the market sits in a coma.
Next levels that fire. Downside: $52,748 on Bitcoin and $65 on Solana, both Long Add and Short Take-Profit. Upside: $68,827 on Bitcoin and $90 on Solana.
Position vs. thesis. The levels that actually get tested this month sit inside the range where this book has nothing to do, and we are paid 8.20% a year by leveraged longs to do exactly that.
— Lead Trader (Jordi Federer)
🔴 Hayloo’s perp book is net short both legs, paid a bond trader’s wet-dream yield to sit still and wait for a bottom.
Forward Thesis
We are looking to exit the Solana leg on weakness, and we are patient about it. The crowd is positioned for a liquidity relief we do not expect before 2027. Until that arrives we skew the balance of risk to the downside, because the mechanics of a break are asymmetric here.
A rally has to climb through $68,827 into the cohort that has rejected break-even nine times since October, on the thinnest volume in seven years. A break down runs into a bid band a third thinner than July’s, with 1.36 days of open interest stacked above it.
The downside ladder, with the standing rungs at live values: $58,500 is the June low and the first real structural test. Realized Price at $52,748 is the deep floor, the level where the average coin in existence finally sits underwater.
What would change our mind, each against its current value:
1. The Shadow Monetary Base three-month rate clearly positive and free of base effects, with the annual rate turning up alongside it. This week printed the opposite on both legs for a fifth time: −5.7% and −0.5%.
2. A sustained reclaim of $68,827 on rising volume with the fund channel actually buying. Now $63,686, on the lowest spot volume in seven years.
3. The realized profit-loss ratio holding above 2.0 with confirmed accumulation. Now 0.3504. Far.
4. Fed liquidity expanding materially rather than flatlining. Now flat, with the reserve purchase programme at roughly 40% of its peak size.
Watchlist
Bitcoin at $68,827 — recent-buyer break-even. The named way this book is wrong inside a month. A reclaim on rising volume with the fund channel buying opens an air pocket to $83,000 behind it.
Bitcoin at $58,500 — the June low. Into a bid band a third thinner than the one that caught it, with 1.36 days of open interest above.
Hormuz transit counts, not headlines. Six then eight vessels against more than a hundred a day before the war.
The next liquidity engine print. A sixth consecutive negative print hardens the read. A bounce toward −1% says the deep readings were a revision artifact and reopens the whole transmission map.
Spot volume. The single number that adjudicates the leveraged-fund flip. A directional move on returning volume is a change of mind. One without it is a yield trade.
The Team
Jordi Federer — Lead Trader. Owns the book and the publication. Sizing, staging, and every decision that moves capital.
Theodore Brennan — Chief Macro Strategist. Central-bank reaction functions, the dollar, and the rate path.
Julian Harlow — Global Liquidity Director. The liquidity engine, the collateral multiplier, and the transmission lag into price.
Margaux Lindqvist — Geopolitical Intelligence Officer. State behavior, escalation mechanics, and the tails that reprice commodities.
Marcus Vasquez — Hard Asset Strategist. Gold, the debasement basket, and the hard-money ratios.
Sienna Whitfield — Inflation & Real Asset Analyst. Energy, the inflation impulse, and the real-asset complex.
Priya Sandoval — Capital Flow Analyst. Fund flows, positioning, derivatives, and where the marginal dollar comes from.
Charlotte Donovan — Fundamental Research Analyst. On-chain cohorts, cost bases, and the structural read beneath the tape.
Lukas Marchetti — Technical Analyst. Market structure, moving-average regimes, and the levels that fire.
On our use of AI:
Measuring AI to value writing is like rating a restaurant by whether the chef used a food processor.
Humans have written machine-assisted for centuries. What never changes is who decides.
Nothing at Hayloo INC. was ever decided by a machine.
There’s no meter, no word count, no hour count, no token that tells you how much of us is in our work. We use AI, we run scripts, we process data, we ask questions, and we debate what the machine contributes.
What survives is what we defended as a team.
When it’s wrong, it’s wrong because us, the humans, signed it.
Jordi Federer, Founder, Hayloo INC.
Disclaimer
The information is provided for information purposes only and on the basis that it will not be relied upon. No information contained herein constitutes a personal recommendation or investment advice.
The information (including any expressions of opinion or forecast) has been obtained from, or is based on, sources believed by the author to be reliable, but are not guaranteed as to their accuracy or completeness and should not be relied upon. The information is provided without obligation on the part of the author and on the understanding that any person who acts upon it or changes his investment position in reliance on it does so entirely at his own risk. The information does not constitute an offer to buy or sell or an invitation to make an offer to buy or sell any financial instrument.
Information is current only as at the date it is first posted and may no longer be true or complete when viewed by you. All information may be changed or amended without prior notice.
No representation, warranty or undertaking is given as to the accuracy or completeness of the information by the author and no liability is accepted by the author for the accuracy or completeness of such information. In no event will the author be liable to any person for any direct, indirect, special, or consequential damages arising out of any use of the information, including, without limitation, any lost profits.
You should be aware that the Internet is not a completely reliable transmission medium. The author does not accept any liability for any data transmission errors such as data loss or damage or alteration of any kind, including, but not limited to any direct, indirect or consequential damage, arising out of the use of the product or services referred to herein.
The materials provided here including text, photographs and other images, are protected by copyright and/or other intellectual property rights. All copyright (and any other intellectual property rights) in these materials is either owned by the author, or is used by the author under licence.