


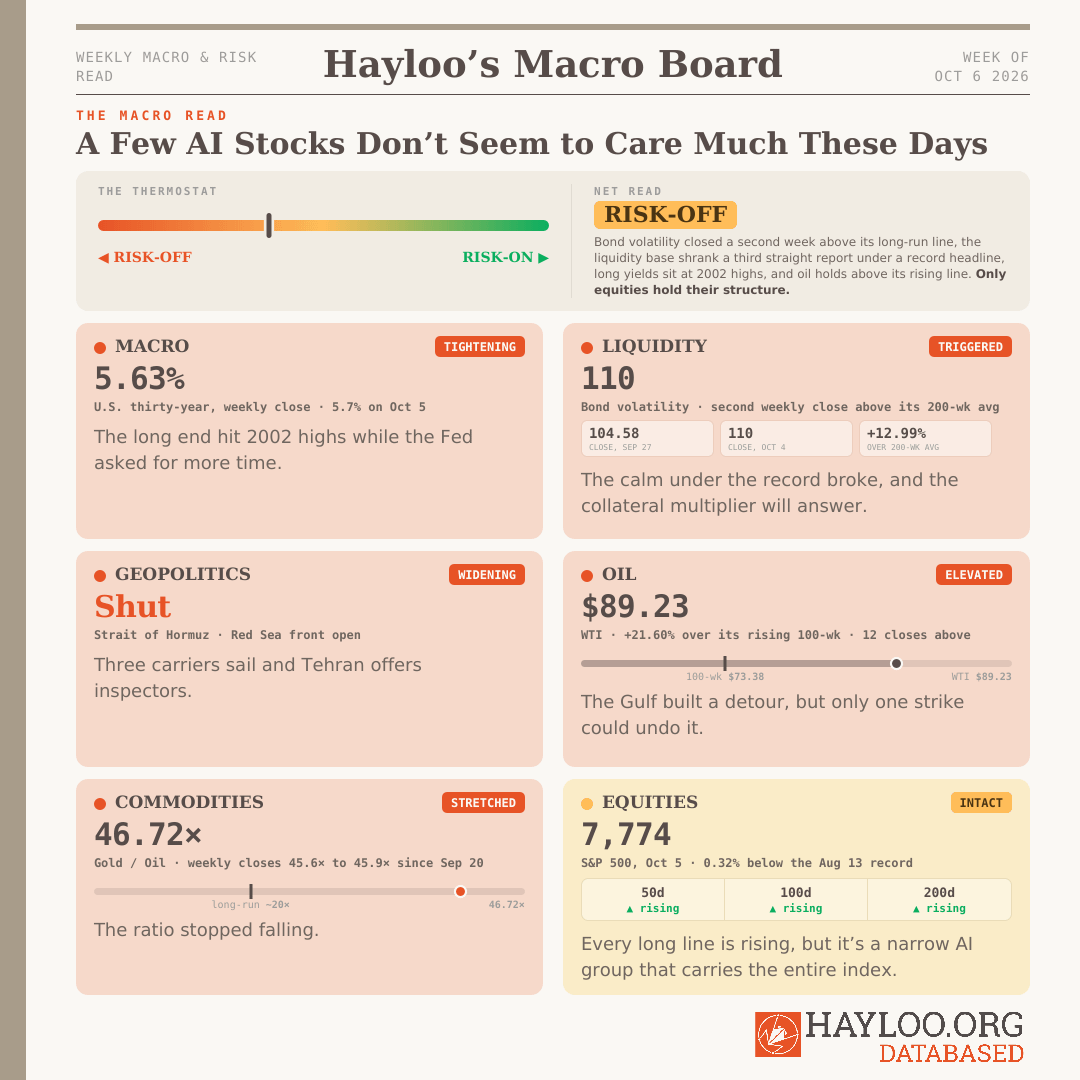
Bond volatility closed a second straight week above its long-run average on October 4, and that is the risk-off trigger we watch. The MOVE index (the Merrill Lynch Option Volatility Estimate) prices the swings traders expect in U.S. Treasuries. It closed the week at 110, 12.99% above its 200-week average.
The calm this bond volatility breaks is the collateral holding up global liquidity. On Michael Howell’s October 6 count, global liquidity set yet another record number, while the collateral base underneath keeps shrinking at an accelerating pace. Currently, the Shadow Monetary Base serving as collateral for this record headline liquidity sits at its lowest in 16 months. Since August, record headline liquidity comes from more lending against the same base collateral. This collateral multiplier churns liquidity into the economy on calm bonds. The calm is over. Sustained higher bond volatility could impact global liquidity negatively in Q4 2026.
The long end did not wait for the data to confirm the collateral troubles. On October 5 the ten-year Treasury yield rose to 5.34% and the thirty-year to 5.7%, both the highest since 2002. The Federal Reserve (Fed) spent the week asking for more time. We remember asking the market for time at Hayloo several times. The market never listened.
On our use of AI:
We’re a private crypto fund out of Switzerland. We built a Neurosymbolic Compound AI System for our own desk: it follows our strategies, it reads the news that affect our portfolio, it sits on a database going back decades, and brings math to our everyday emotions. We call it Hayloo. It’s our best hire. This Substack is compiled by Hayloo and approved by us.
Humans have written machine-assisted for centuries. What never changes is who decides.
Nothing at Hayloo INC. was ever decided by a machine. What we publish is what we defend as a team. When it’s wrong, it’s wrong because humans signed it.
Jordi Federer, Founder, Hayloo INC.
This week’s read opens on the test our team set in September and what happened when it landed. It carries the collateral base’s third negative report, impacting liquidity in Q4 2026. We’re talking about the long end at 2002 highs, a war that reached the Red Sea, the Gulf building a detour around a closed strait, gold’s worst week since June, yet stocks a third of a percent from their record, carried by a narrow group of AI companies, now facing higher borrowing cost.
Our book is short Bitcoin, Ether, and Solana. People behind Hayloo may hold any asset discussed here, in either direction. Nothing here is advice to buy or sell.
A newsreader that ranks each morning’s news from Hayloo’s sources and keeps six months of it for your AI is being built. Join the waitlist.
By the end of this week, there will be a
— PAYWALL —
below this box.
If you subscribe today,
we will grandfather your subscription
to “forever free”
before we shut the door.
Our Team Splits on Whether Loud Bonds Will Break the Record
Since September our team has read the record liquidity headline two ways. Julian Harlow, our Global Liquidity Director, reads a headline held up over a shrinking base as a plateau. Priya Sandoval, our Capital Flow Analyst, reads the same headline as fuel for risk assets this quarter. What we like about granular liquidity measures beyond the M2 money supply is the crystal ball they give us. Liquidity takes time to reach markets. In September we wrote that a weekly close in bond volatility above 100 would threaten record liquidity, because volatile bonds raise the haircuts lenders take on collateral, and higher haircuts pull the collateral multiplier down.
Bond volatility has now closed above 100 twice: 104.58 for the week of September 27 and 110 for the week of October 4. But the collateral multiplier has not moved yet. The rise in bond volatility has yet to feed through the system to reach collateral haircuts. Equities sit 0.32% from their own record. Their liquidity cushion is intact. But the record sits on a one-legged foundation that just started to shake.
🟠 The test we set landed, but the lever has yet to move.
— Global Liquidity Director (Julian Harlow) · Capital Flow Analyst (Priya Sandoval)
Liquidity Tape: The Base Shrank Again Under Another Record
Michael Howell‘s October 6 update puts global liquidity at another record, a little above the week before. Its three-month annualized growth picked up and its annual growth held steady, both well below their mid-summer pace. The base underneath, central-bank money plus high-grade collateral, sits at its lowest in 16 months. Both of its growth rates sank further below zero. Howell puts the latest dip down to weaker bond collateral values and a firmer dollar.
Both of the collateral base’s growth rates were negative three weekly reports in a row. We call a rollover only when that happens and the headline itself falls. The headline set a record, so the test isn’t met.
We read the global liquidity setting as a squeeze. The base is contracting while the cost of debt rises: the thirty-year Treasury closed its week at 5.63%, the U.S. mortgage rate stood at 7.30% in the week to September 25, and euro-area inflation rose to 3.8%. Policy has no room to ease into that.
🟠 The base shrank a third straight report, and the record above it stands on shaky ground.
— Global Liquidity Director (Julian Harlow)
Macro Tape: The Long End Broke Out While the Fed Asked for Time
The thirty-year Treasury closed the week to October 2 at 5.63%, from 5.49%. The ten-year real yield, what the bond pays after inflation, closed at 2.92%, from 2.83%. Citadel Securities’ Nohshad Shah wrote on October 5 that almost all of September’s rise in the ten-year came from real yields, with inflation expectations steady. In our read, a strong economy is pushing long rates up.
The rest of the world sold along the U.S.. Britain’s thirty-year gilt touched 6% on October 1. France’s ten-year spread over Germany reached 137 basis points on October 5, against 85 a month earlier, and U.S. municipal bonds had their worst month in nearly two decades. Japan set the coupon on its new ten-year bond at 3.1%, against 2.1% in January to March, and bidders still covered the auction 3.76 times against a 12-month average of 3.21. That money has been funding foreign governments’ deficits, the U.S. included, in the past, and it now earns better at home.
At the Fed, Vice Chair Philip Jefferson said on October 1 that it may take more time to judge whether more hikes are needed. Odds of a move at the October 28 meeting fell to 30% from 70%, and odds of at least one hike by year-end to 80% from 95%, as CoinDesk reported. Markets tend to remind the laggards that it’s the markets that set the clock, not the Fed.
After September payrolls came in at 29,000, bond traders priced a later start to further hikes. Currently, the two-year yield is pricing up to three more quarter-point hikes over the next year, which leaves the Fed behind the curve.
🔴 The long end broke out to 2002 highs, and the Fed asked for more time.
— Chief Macro Strategist (Theodore Brennan)
Geopolitical Tape: Three Carriers Sail, and the War Reached the Red Sea
Carrot and stick are both present at the same time around Iran. A U.S. official told Al Jazeera that three aircraft carriers and two amphibious groups will be in position by the end of November. In the same week Iran’s foreign minister offered, in private talks, to restore nuclear inspectors’ access in exchange for sanctions relief, and the U.S. Treasury sanctioned Iran’s rail and auto groups. Parliament speaker Mohammad Bagher Ghalibaf said the Strait of Hormuz stays shut until seven conditions from a June interim agreement are met. The fighting now reaches the Red Sea route as well as Hormuz.
At home, support for the war is thin. In an Associated Press survey, 70% of U.S. adults say the war has not been worth fighting, and a Reuters poll has registered voters preferring Democrats 44% to 37%. The November 3 midterms stay the war’s last remaining dated gate.
🔴 Force and talks are building together, the strait stays shut, and the fight reaches the Red Sea.
— Geopolitical Intelligence Officer (Margaux Lindqvist)
Commodity Tape: The Gulf Built a Detour Around a Closed Strait
WTI, the U.S. crude benchmark, read $89.23 on October 5. That is 21.60% above its 100-week average of $73.38, and that average rose 2.97% over thirteen weeks. The weekly close of $90.80 on October 4 was the twelfth straight above it, in a run that started on July 17. Brent traded at $100.88 on October 6.
The Gulf is moving its oil around the shut strait. Kpler counted Middle East crude exports of 19.5 to 22.5 million barrels a day on four days in the last week of September, against about 18 million before the war, and Gulf flows excluding Iran ran above 81% of pre-war levels in September.
In our read the shrinking gap between crude and its long average comes from barrels rerouted around a strait that is still closed. One strike would reverse it.
🔴 Crude holds far above its rising line on barrels rerouted around a strait still shut.
— Inflation & Real Asset Analyst (Sienna Whitfield)
Hard Assets: Gold Fell to the Dollar, and Bitcoin Closed Above 20×
Gold read $4,169 on October 5, 2.23% under its 20-week average of $4,264.23, as traders weighed the stronger dollar and higher yields.
Our team splits on what moved gold. Julian Harlow sides with Michael Howell: a People’s Bank of China (PBoC) liquidity print through the third quarter should lift gold into the fourth. Marcus Vasquez, our Hard Asset Strategist, reads September’s fall as a dollar and real-yield story, unconsidered what the PBoC is buying.
Gold priced in oil reads 46.72×. The ratio that must give in for a healthy economy stopped falling, and it sits at more than twice the long-run level of about 20×.
Bitcoin priced in gold closed the week of October 4 at 20.75×, an early-bull level, challenged by macroeconomic reallocations and geopolitical turmoil. We respect the ratio, but we can’t ignore the fact that the move came as much from gold falling as from Bitcoin rising.
🟠 Gold lost 2.15% on the week to the dollar and yields, and Bitcoin took the bait.
— Hard Asset Strategist (Marcus Vasquez)
Equity Tape: A Third of a Percent From the Record, Every Long Line Rising
The S&P 500 closed at 7,774 on October 5, 0.32% below its August 13 record close of 7,798.99. The Nasdaq 100 set a record, and Nvidia’s market value reached $5.76 trillion. Volume on October 5 was 3.47 billion shares against a 20-day average of 3.23 billion.
Lukas Marchetti, our Technical Analyst, reads the structure as intact. The 50-, 100-, and 200-day averages are all rising and the index sits above each of them. The index’s lead over the long averages, however, narrowed, and the 20-day average is still falling.
A narrow group carries the entire index, as demand for artificial intelligence (AI) keeps rising. The money for the AI build keeps flowing, at a higher price. JPMorgan is marketing a $5 billion loan for Volta Infrastructure at a yield of about 11%. Stonebriar sold $869 million of asset-backed securities, about 15% of them backed by AI chip loans. OpenAI is seeking $30 billion at a value of about $1.4 trillion, and Anthropic is targeting an initial public offering as soon as mid-November. Bank of England Governor Andrew Bailey told the U.K. to prepare for market shocks from an AI correction.
🟠 Every long line is up, and a narrow AI group carries the rally into rising borrowing cost.
— Technical Analyst (Lukas Marchetti)
What We’re Watching
We’re curious about the upcoming reads of the collateral multiplier, after bond volatility briefly hit 114. Our risk-off trigger stands until the MOVE index closes a week back under its 200-week average. The September consumer and producer price prints will give insight into whether refined fuel is driving inflation and test the thirty-year above 5.5% on weekly closes. We’re looking out for prints of Japanese net selling of foreign bonds, and we’re watching gold at $4,000, currently 4.22% above.
Our Sources This Week
This week the desk read Michael Howell’s Global Liquidity update of October 6 and his pieces of October 2 and October 5. Subscribe to Howell’s research for his full data.
Our book is short Bitcoin, Ether, and Solana. People behind Hayloo may hold any asset discussed here, in either direction. Nothing here is advice to buy or sell.
A newsreader that ranks each morning’s news from Hayloo’s sources and keeps six months of it for your AI is being built. Join the waitlist.
The Team
Jordi Federer — Lead Trader. Owns the book and the publication. Sizing, staging, and every decision that moves capital.
Theodore Brennan — Chief Macro Strategist. Central-bank reaction functions, the dollar, and the rate path.
Julian Harlow — Global Liquidity Director. The liquidity engine, the collateral multiplier, and the transmission lag into price.
Margaux Lindqvist — Geopolitical Intelligence Officer. State behavior, escalation mechanics, and the tails that reprice commodities.
Marcus Vasquez — Hard Asset Strategist. Gold, the debasement basket, and the hard-money ratios.
Sienna Whitfield — Inflation & Real Asset Analyst. Energy, the inflation impulse, and the real-asset complex.
Priya Sandoval — Capital Flow Analyst. Fund flows, positioning, derivatives, and where the marginal dollar comes from.
Charlotte Donovan — Fundamental Research Analyst. On-chain cohorts, cost bases, and the structural read beneath the tape.
Lukas Marchetti — Technical Analyst. Market structure, moving-average regimes, and the levels that fire.
Disclaimer
The information is provided for information purposes only and on the basis that it will not be relied upon. No information contained herein constitutes a personal recommendation or investment advice.
The information (including any expressions of opinion or forecast) has been obtained from, or is based on, sources believed by the author to be reliable, but are not guaranteed as to their accuracy or completeness and should not be relied upon. The information is provided without obligation on the part of the author and on the understanding that any person who acts upon it or changes his investment position in reliance on it does so entirely at his own risk. The information does not constitute an offer to buy or sell or an invitation to make an offer to buy or sell any financial instrument.
Information is current only as at the date it is first posted and may no longer be true or complete when viewed by you. All information may be changed or amended without prior notice.
No representation, warranty or undertaking is given as to the accuracy or completeness of the information by the author and no liability is accepted by the author for the accuracy or completeness of such information. In no event will the author be liable to any person for any direct, indirect, special, or consequential damages arising out of any use of the information, including, without limitation, any lost profits.
You should be aware that the Internet is not a completely reliable transmission medium. The author does not accept any liability for any data transmission errors such as data loss or damage or alteration of any kind, including, but not limited to any direct, indirect or consequential damage, arising out of the use of the product or services referred to herein.
The materials provided here including text, photographs and other images, are protected by copyright and/or other intellectual property rights. All copyright (and any other intellectual property rights) in these materials is either owned by the author, or is used by the author under licence.
Great question. But isn’t the bond market already blinking.