


On September 25 Japan’s ten-year government bond yield hit 3.115%, its highest since August 1996. A Reuters report carried that day said Japanese money has started heading home, with a larger wave held back until investors know where their own yields peak. Goldman Sachs moved its yen call to 150 per dollar in twelve months on that flow.
Here is what that flow looks like from the inside. A Japanese insurer that can earn more on a bond at home can sell a U.S. Treasury to buy it. In our reading that choice turns on Tokyo’s yields, and nothing the Federal Reserve (Fed) does or says will change it. Tokyo also sent a signal the other way. On September 29 Japan’s 40-year auction drew its strongest demand in six years. Our team reads that auction two ways. The number that settles it is the size of Japanese net selling of foreign bonds.
The selling in long bonds ran around the world. Britain paid its highest yield since 1999 at a ten-year auction. France’s premium over Germany reached 120 basis points, with a record €340 billion of bonds planned for 2027. Australia’s central bank raised its rate to 4.6% on September 29, its highest since 2011.
The Fed spent the week talking. Governor Michael Barr said again on September 29 that further rate increases are likely needed. John Williams of the New York Fed said on the same day that his base case is one more increase this year, with no urgency. The two-year Treasury yield slipped to 4.88% from 4.96%, and the thirty-year barely moved.
We run a crypto fund, and our team reads the bond market before anyone at the desk opens a Bitcoin chart. Treasuries are the collateral much of the world borrows against. In our read, a large seller of them reaches every market built on that borrowing, crypto included.
On our use of AI:
We’re a private crypto fund out of Switzerland. We built a Neurosymbolic Compound AI System for our own desk: it follows our strategies, it reads the news that affect our portfolio, it sits on a database going back decades, and brings math to our everyday emotions. We call it Hayloo. It’s our best hire. This Substack is compiled by Hayloo and approved by us.
Humans have written machine-assisted for centuries. What never changes is who decides.
Nothing at Hayloo INC. was ever decided by a machine.
What we publish is what we defend as a team. When it’s wrong, it’s wrong because humans signed it.
Jordi Federer, Founder, Hayloo INC.
hayloo.org
This week’s read opens on both sides of our split over Japan, and on what the bond market’s gauge of calm did this week. It gives the date that fires our trigger, and the windows when we expect the pressure to reach risk assets. It carries the rest of the desk’s week as well: Washington’s answer on Hormuz, diesel at records, gold under its line, and the junk bonds now paying for the artificial intelligence (AI) build.
Our book is short Bitcoin, Ether, and Solana. People behind Hayloo may hold any asset discussed here, in either direction. Nothing here is advice to buy or sell.
A newsreader that ranks each morning’s news from Hayloo’s sources and keeps six months of it for your AI is being built. Join the waitlist.
In a week from now, there will be a
— PAYWALL —
below this box.
If you subscribe today,
we will grandfather your subscription
to “forever free” before we shut the door.
Our Team Splits on How Big Japan’s Flow Is
Priya Sandoval, our Capital Flow Analyst, reads this week’s news from Japan as the start of a Treasury-market event, because a Japanese insurer selling Treasuries to buy a bond at home doesn’t care what the Fed says next. Margaux Lindqvist, our Geopolitical Intelligence Officer, wants a size before she calls it a flow. She reads Japan’s 40-year auction on September 29, its strongest demand in six years, as money staying home. The number that settles it is the size of Japanese net selling of foreign bonds, including the largest foreign stash of U.S. Treasuries.
🟢 Japan’s money has started home, and nobody has put a size on it yet.
— Capital Flow Analyst (Priya Sandoval) · Geopolitical Intelligence Officer (Margaux Lindqvist)
Liquidity Tape: Why Tokyo Reaches a Crypto Fund
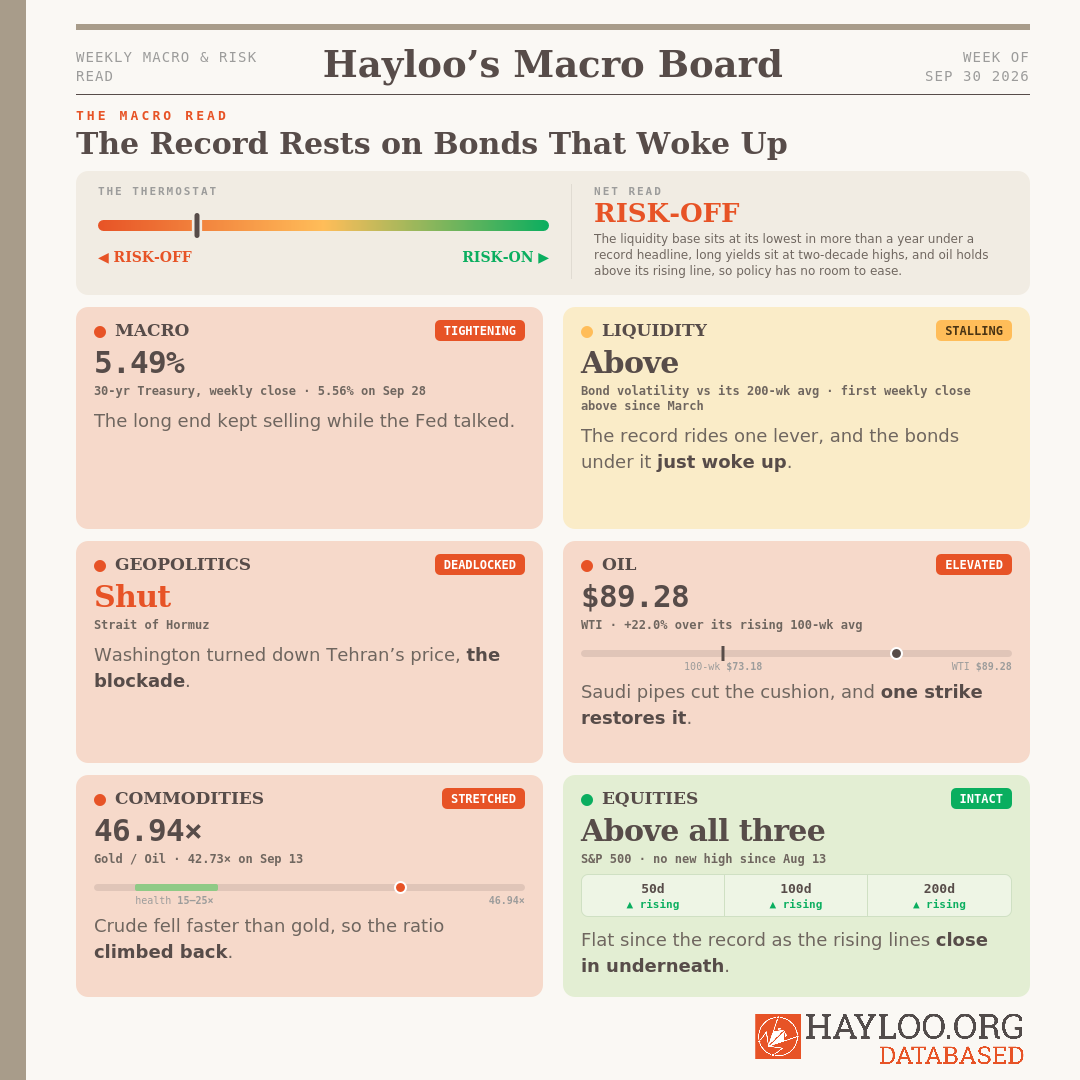
Record global liquidity stands on one lever, and a large seller of Treasuries would pull it. On Michael Howell‘s count, the world’s money hit a record this week, while the base underneath it, central-bank money and collateral, shrank to its lowest in more than a year. We ran the split on Howell’s own weekly table. Since mid-July the base has shrunk by about as much as the headline has grown, and every dollar of the headline’s growth came from the collateral multiplier, which now sits at a record in his data going back to 2010. The multiplier lives on calm bonds, because lower Treasury volatility means smaller haircuts and more lending against the same collateral.
This week Treasury volatility closed a week above its line. The MOVE index (the Merrill Lynch Option Volatility Estimate), which Intercontinental Exchange (ICE) publishes, prices the swings traders expect in Treasuries. On ICE’s index, Treasury volatility closed the week of September 27 above its 200-week average for the first time since March, after about half a year of weekly closes under it. One weekly close above that line is our alert. A second, in the week ending October 4, is our trigger.
By our own test, the world’s money hasn’t rolled over yet. We call a rollover only on three weekly prints in a row that show both of the base’s growth rates negative and the headline itself lower. The headline sits at a record, so the test isn’t met. We read the setting around it as a squeeze. Inflation expectations, government bond yields around the world, and mortgage rates are all rising, so policy has no room to ease a stalling engine. On Howell’s September 29 update, the base’s three-month rate sank further this week and its annual rate went deeper below zero. We expect pressure on risk assets in Q4 2026.
🟠 A record headline on one lever, and the bonds holding that lever up just closed a week above their line.
— Global Liquidity Director (Julian Harlow)
Macro Tape: The Long End Kept Selling While the Fed Talked
The thirty-year Treasury closed the week of September 25 at 5.49%, its highest weekly close since May 2002, and printed 5.56% on September 28. The ten-year closed September 23 at 5.11%, up 15 basis points in a session after a weak $70 billion five-year auction. The ten-year real yield, what the bond pays after inflation, reached 2.90% on September 28.
The market’s odds of a hike in October fell from better than two in three to about even. Theodore Brennan, our Chief Macro Strategist, reads the two-year as a bet on the Fed’s next move. In his read the thirty-year is pricing the supply of government debt and the price of energy.
Long Treasuries could pay a strong return over the next twelve months, because history shows the real economy breaking as long rates approach the level the thirty-year just printed through. Julian Harlow, our Global Liquidity Director, reads the next large move in yields as down, delivered by a growth scare. Sienna Whitfield, our Inflation and Real Asset Analyst, says the inputs haven’t turned. One-year consumer inflation expectations jumped to 4.6% from 4.0%. Diesel set records on both sides of the Atlantic, Spain printed 4.9% inflation and France 3.0% in September, and Barclays and RBC both put a 6% thirty-year yield in range. Our reading is that both roads to lower yields run through weaker growth, and neither is kind to risk assets this quarter.
The real economy is splitting in two. On S&P Global‘s flash survey, the U.S. composite purchasing managers’ index reached 58.4 in September, its highest since July 2021, and jobless claims fell to 197,000. Households went the other way. Consumer confidence fell to its lowest since 2014 on the Conference Board‘s survey, sentiment fell to 48.1 from 51.7 on the University of Michigan‘s, and the thirty-year mortgage rate reached 7.12%, its highest since May 2024. Output runs hot while households pay the energy bill and the borrowing cost, and in our read housing and the consumer break first. Job openings fell to a five-month low in the same stretch.
🔴 The long end did the tightening this week, and the Fed was left describing it.
— Chief Macro Strategist (Theodore Brennan)
Geopolitical Tape: Tehran Named Its Price, and Washington Passed
Iran’s President Masoud Pezeshkian told the United Nations General Assembly on September 23 that Hormuz stays closed while sanctions and the U.S. blockade stand. That made the blockade the price of the strait. On September 24 negotiators were reported to be exploring that exact trade, the strait for the blockade. The same day the Houthis claimed strikes on Saudi Aramco facilities at Yanbu, the Red Sea end of the kingdom’s pipeline around the strait. On September 26 President Trump rejected Iran’s seven-day proposal, and explosions were reported near Qeshm Island within hours. Foreign Minister Abbas Araghchi asked for Washington’s final answer by September 29, and a U.S. official said no agreement comes without the nuclear program on the table. That being said, the November 3 midterms remain the war’s dated gate.
Trade brought no relief. Washington and Beijing extended their truce by two months, to January 10, after a state visit that released no concrete agreements. Soybeans stayed off the lists of goods recommended for tariff cuts, and rare earths were pushed to another round. Talk about getting sh*t done.
🔴 Washington turned down Tehran’s price, and the strait stays shut.
— Geopolitical Intelligence Officer (Margaux Lindqvist)
Commodity Tape: Saudi Pipes Moved the Barrel, and Diesel Set Records
West Texas Intermediate (WTI), the U.S. crude benchmark, closed at $89.28 on September 29. That is 12.9% under its $102.45 weekly close of September 13, and the war has not ended. It still sits 22.0% above its 100-week average of $73.18, and that average is 2.6% higher than it was thirteen weeks ago. Eleven straight completed weekly closes sit above it, from July 17 through the $93.39 close of September 27.
Plumbing moved the barrel. Saudi Arabia restored about half the flow through its East-West pipeline, which runs around Hormuz, and then resumed flows through it. The recovery rests on infrastructure one strike can take out again, and the Houthis hit its Red Sea end on September 24.
Diesel is where the war lands on prices. U.S. retail diesel topped $6.50 a gallon on September 23, a record. Europe’s diesel premium over Brent crude passed $95 a barrel the same day, a record in data back to 2011, and the European Union’s average pump price for diesel hit a record €2.23 a liter. Sienna Whitfield reads the shortage as one of refining capacity, so an export ban would reshuffle the queue for diesel and add no volume to it. The White House denied a report of such a ban, and President Trump then said he is still considering one.
🔴 Crude fell on rerouted pipes and still sits far above its rising line, while diesel set records the pipes cannot reach.
— Inflation & Real Asset Analyst (Sienna Whitfield)
Hard Assets: Gold Slipped Under Its Line on Real Yields
Gold reads $4,191, 2.2% under its 20-week average of $4,283.81, and its September 27 weekly close of $4,260.93 also finished under the line. Spot fell 3.3% to $4,146.51 on September 28, its lowest since August 5. Our floor sits at $4,000, 4.8% below, with a deep floor at $3,700.
Marcus Vasquez, our Hard Asset Strategist, reads a rate story first. The ten-year real yield rose to 2.90% and the dollar had its best month since June, and both raise the cost of holding a metal that pays nothing. Beijing is the second leg. Gold follows the liquidity the People’s Bank of China (PBoC) pumps, and the injections have slowed. If gold falls on rates while the Chinese tap stays open, our floor holds. A slowing tap puts the floor in play. The PBoC’s record overnight lending window from September 28 to October 8, capped at 1 trillion yuan a day, is the next read on the tap.
Gold priced in oil reads 46.94×. On weekly closes it fell from 53.13× at the end of August to 42.73× on September 13, then climbed back to 45.63× at the September 27 close, because crude has fallen 12.9% since the September 13 close and gold only 4.3%. Howell expects the ratio to keep falling toward a long-run center near 20× as industrial demand takes over. We agree on where it ends up and part ways on the last fortnight: the driver right now is Saudi logistics, and one strike can send it back the other way.
Bitcoin priced in gold reads 19.96× on live marks and 19.82× on the September 27 weekly close. Last week’s live print touched the 20× line our desk calls early-bull, and on a weekly close it still hasn’t crossed. Outside gold the commodity run continues, with copper and the broad commodity index having very large years.
🟠 Gold slipped under its 20-week line on real yields while the $4,000 floor holds, and Bitcoin fell back just under 20× gold.
— Hard Asset Strategist (Marcus Vasquez)
Equity Tape: Stocks Hold Above Rising Lines While the AI Build Borrows From the Junk Market
Lukas Marchetti, our Technical Analyst, reads the S&P 500’s structure as intact. The index hasn’t made a new high since its August 13 record, and it has gone nowhere since then while its long averages kept rising. It sits just above its 20-day average and above rising 50-, 100-, and 200-day averages, and it hasn’t closed under the 100-day or the 200-day since April. More than half of this month’s sessions, however, closed under the 20-day average, and the gap to each of the three longer lines keeps shrinking.
Earnings are holding the index up while valuation multiples compressed. Theodore Brennan points to what the index hasn’t priced. Long rates at two-decade highs raise the bar for those earnings. Wells Fargo cut its year-end target for the index to barely above where it closed on September 28. U.S. industrial stocks fell hard over the past month, and Citigroup’s earnings-revision index turned net negative on September 23 for the first time in 23 weeks.
The AI bill is on paper now, and junk bonds are paying it. SoftBank sold $11.1 billion of high-yield bonds on September 23, the largest such sale on record, to fund a stake in OpenAI. Anthropic’s initial public offering prospectus sets out $518 billion of planned spending against a 2025 net loss of $42 billion. Goldman Sachs’s credit strategists say the supply has pushed high-yield risk premiums to a five-month high. Protection on Nvidia’s debt changed hands for $6.9 billion in six months, against $640 million in the six months before. Oracle sent a force-majeure notice to a New Mexico data-center developer on September 27. Capital spending financed through credit reprices in credit first, and we will judge it by what that paper trades at a month from now.
🟢 Above every rising line, with the lines closing in and the AI build financed from the junk shelf.
— Technical Analyst (Lukas Marchetti)
What We’re Watching
A second weekly close in bond volatility above its 200-week average on October 4 is our trigger. Howell’s next flash print tells us whether the multiplier held its record or came off it. The size of Japanese net selling of foreign bonds settles the split between Priya Sandoval and Margaux Lindqvist. The PBoC’s overnight window runs to October 8 and tells Marcus Vasquez whether the Chinese tap is open. Gold’s floor sits at $4,000. The strait stays the war’s open question until the November 3 midterms, and the price of the AI build’s junk bonds a month from now tells us how credit is taking it.
Our Sources This Week
This week the desk read Michael Howell’s Global Liquidity update of September 29 and his piece of September 27. Subscribe to Howell’s research for his full data.
Our book is short Bitcoin, Ether, and Solana. People behind Hayloo may hold any asset discussed here, in either direction. Nothing here is advice to buy or sell.
A newsreader that ranks each morning’s news from Hayloo’s sources and keeps six months of it for your AI is being built. Join the waitlist.
The Team
Jordi Federer — Lead Trader. Owns the book and the publication. Sizing, staging, and every decision that moves capital.
Theodore Brennan — Chief Macro Strategist. Central-bank reaction functions, the dollar, and the rate path.
Julian Harlow — Global Liquidity Director. The liquidity engine, the collateral multiplier, and the transmission lag into price.
Margaux Lindqvist — Geopolitical Intelligence Officer. State behavior, escalation mechanics, and the tails that reprice commodities.
Marcus Vasquez — Hard Asset Strategist. Gold, the debasement basket, and the hard-money ratios.
Sienna Whitfield — Inflation & Real Asset Analyst. Energy, the inflation impulse, and the real-asset complex.
Priya Sandoval — Capital Flow Analyst. Fund flows, positioning, derivatives, and where the marginal dollar comes from.
Charlotte Donovan — Fundamental Research Analyst. On-chain cohorts, cost bases, and the structural read beneath the tape.
Lukas Marchetti — Technical Analyst. Market structure, moving-average regimes, and the levels that fire.
Disclaimer
The information is provided for information purposes only and on the basis that it will not be relied upon. No information contained herein constitutes a personal recommendation or investment advice.
The information (including any expressions of opinion or forecast) has been obtained from, or is based on, sources believed by the author to be reliable, but are not guaranteed as to their accuracy or completeness and should not be relied upon. The information is provided without obligation on the part of the author and on the understanding that any person who acts upon it or changes his investment position in reliance on it does so entirely at his own risk. The information does not constitute an offer to buy or sell or an invitation to make an offer to buy or sell any financial instrument.
Information is current only as at the date it is first posted and may no longer be true or complete when viewed by you. All information may be changed or amended without prior notice.
No representation, warranty or undertaking is given as to the accuracy or completeness of the information by the author and no liability is accepted by the author for the accuracy or completeness of such information. In no event will the author be liable to any person for any direct, indirect, special, or consequential damages arising out of any use of the information, including, without limitation, any lost profits.
You should be aware that the Internet is not a completely reliable transmission medium. The author does not accept any liability for any data transmission errors such as data loss or damage or alteration of any kind, including, but not limited to any direct, indirect or consequential damage, arising out of the use of the product or services referred to herein.
The materials provided here including text, photographs and other images, are protected by copyright and/or other intellectual property rights. All copyright (and any other intellectual property rights) in these materials is either owned by the author, or is used by the author under licence.