


Tape of the Week
The liquidity engine that leads risk assets went negative this week. Michael Howell’s Shadow Monetary Base (SMB) printed −0.1% year-on-year, even as the headline number climbed. The two are not one read. The headline is China restarting injections and a bond market quiet enough to flatter the collateral math; underneath it, the engine is drained by a real economy strong enough to soak up the money that would otherwise chase risk assets. Hence, Bitcoin’s 21-month low at $57,779 this week.
Gold had its worst quarter since 2013 and broke below $4,000; West Texas Intermediate (WTI) crude fell to a four-month low. The dollar is the through-line on every one of them, and it is the heavy weight pushing down Bitcoin.
Our read of Bitcoin’s dealer floor in the low-$60,000s is a bottom being tested, not built. This week’s divergence is the BTC/SOL ratio, up roughly 16% after we called out Solana’s historic asymmetric outrun over Bitcoin last week.
This week, we’re stunned at XRP’s 1.5× more upside than downside over Bitcoin, with no turn signal in sight.
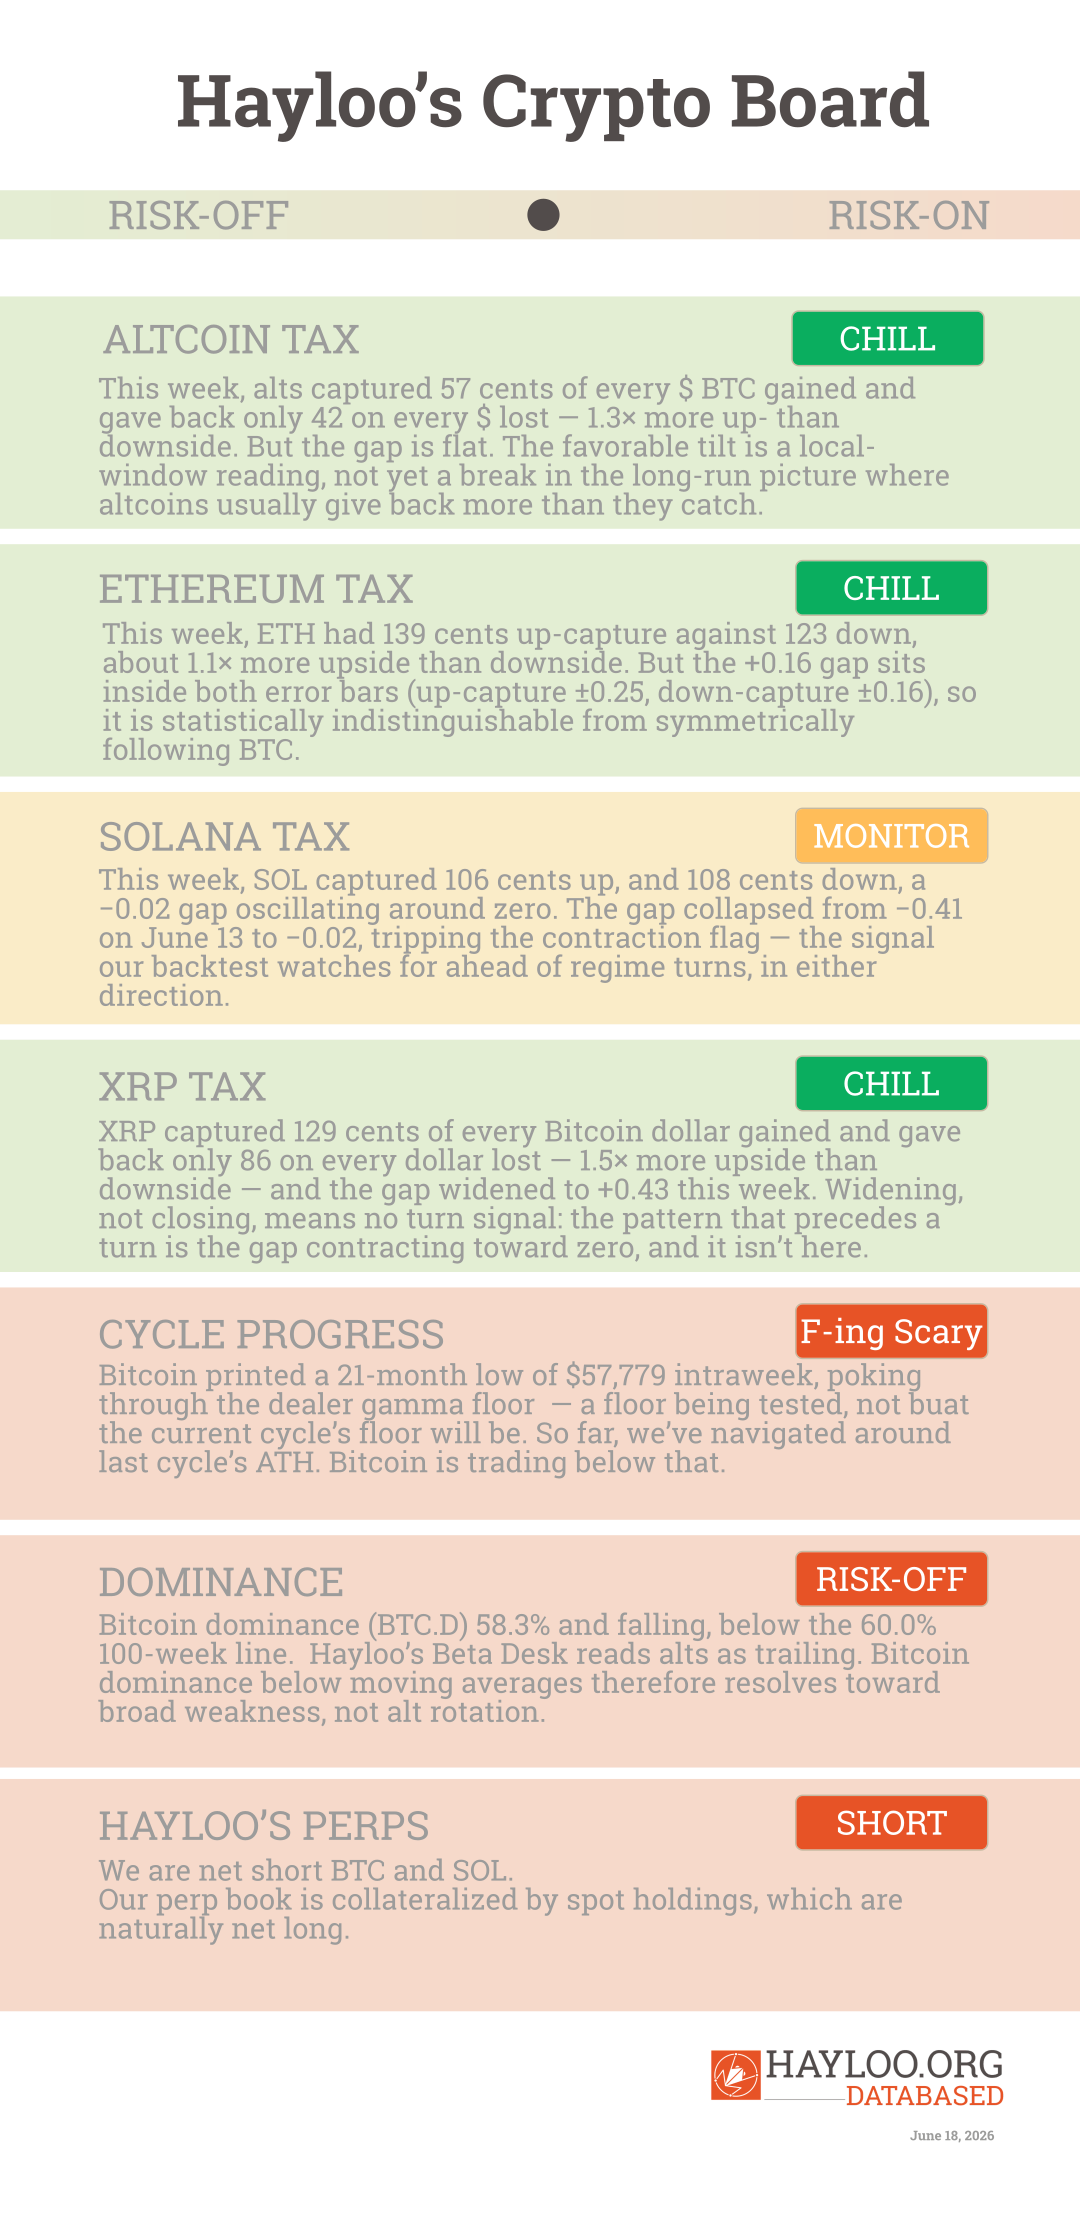
The Alt Tax – Solana’s Record Lead is Beginning to Flash
Beta measures how much a coin moves for each move in Bitcoin. A beta of 1 means it tracks Bitcoin one-for-one; above 1 it amplifies Bitcoin’s moves, below 1 it dampens them. We split that into up-capture (β⁺, how much a coin catches on Bitcoin’s green days) and down-capture (β⁻, how much it gives back on the red days) — when the two differ, there’s an asymmetry, and we watch whether that gap is widening or closing.
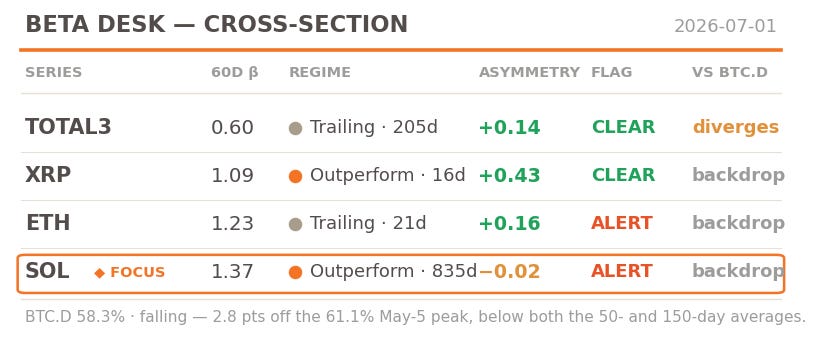
Last week, we put Solana’s Altcoin Tax on watch, tripping the fast-moving contraction flag at our Beta desk. Solana’s relationship to Bitcoin was repricing fast this week.
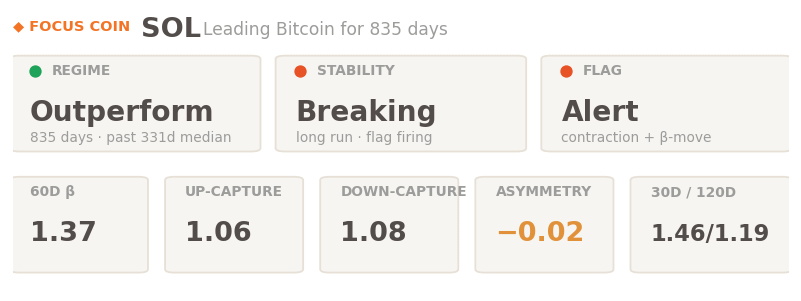
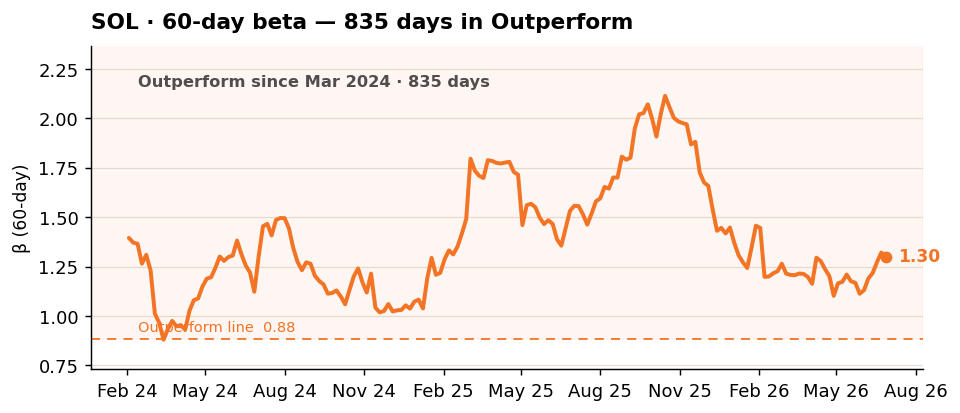
SOL has led Bitcoin for 835 straight days — the longest Outperform run on record, more than double the 331-day median for the regime. But after 835 quiet days the run is no longer sitting still.
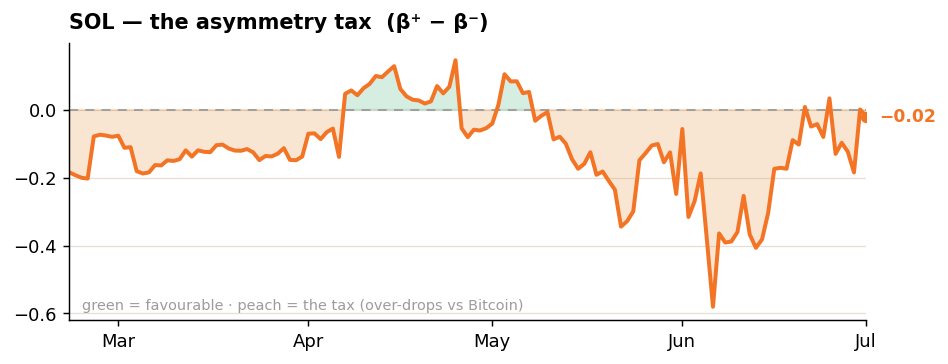
For most of that run SOL carried a down-bias — it caught more of Bitcoin’s downside than its upside, “The Alt Tax”. This week that bias has effectively vanished: up-capture 106 cents, down-capture 108, a −0.02 gap oscillating around zero. The gap collapsed from −0.41 on June 13 to −0.02, tripping the contraction flag — the signal our backtest watches for ahead of regime turns, in either direction.
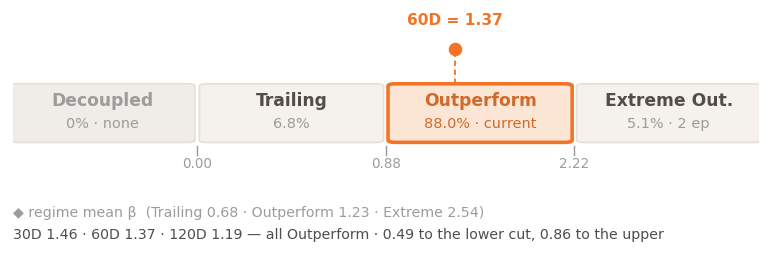
SOL lives in Outperform 88% of its six-year sample, the most one-sided regime distribution on the desk. We keep watching Solana closely.
🟠 This week’s Solana ALT Tax is on Monitor.
XRP — Leading for 16 Days with no End in Sight
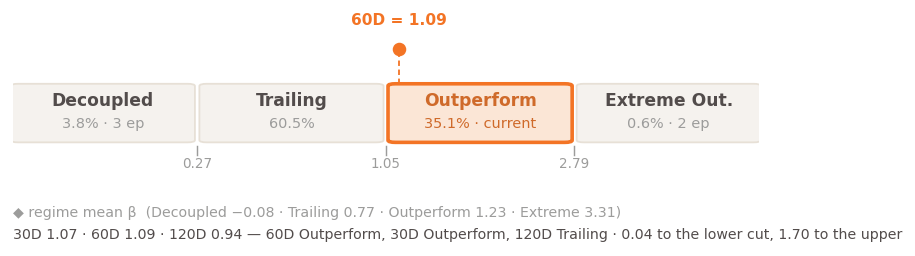
XRP flipped into Outperform over Bitcoin 16 days ago and has held it. This is the cleanest asymmetry on the desk.
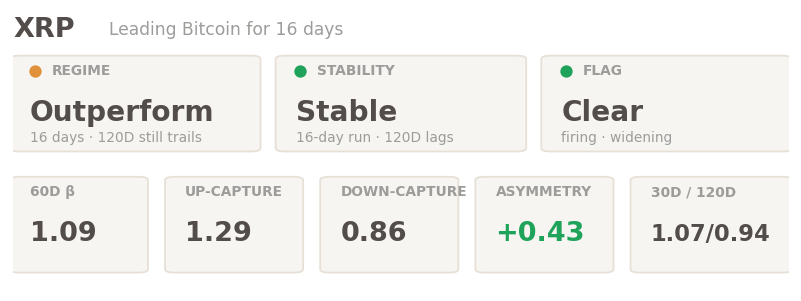
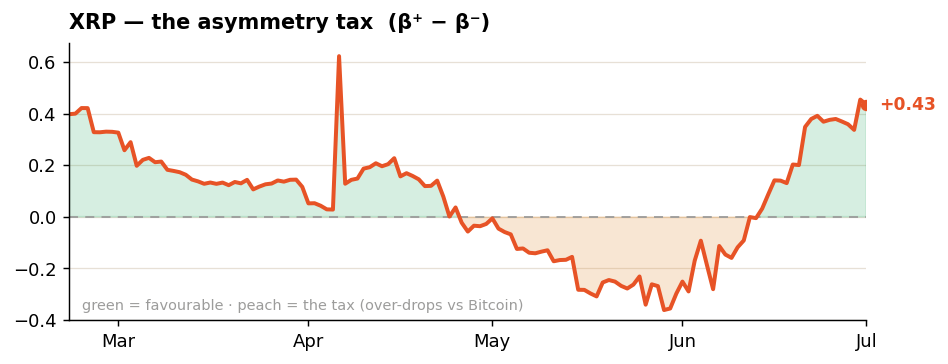
XRP captured 129 cents of every Bitcoin dollar gained and gave back only 86 on every dollar lost — 1.5× more upside than downside — and the gap widened to +0.43 this week. Widening, not closing, means no turn signal: the pattern that precedes a turn is the gap contracting toward zero, and it isn’t here.
XRP is in Outperform 35% of its ten-year sample.
🟢 This week’s XRP Alt Tax is Sweet.
TOTAL3 — the Altcoin Basket, Trailing for 205 Days
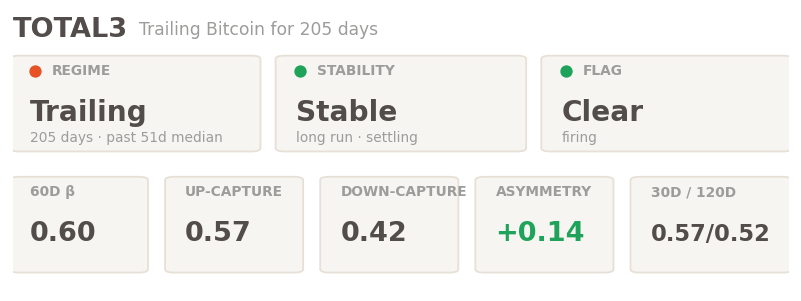
Altcoins as a basket have trailed Bitcoin on the 60-day beta for 205 straight days, well past the 51-day median Trailing run.
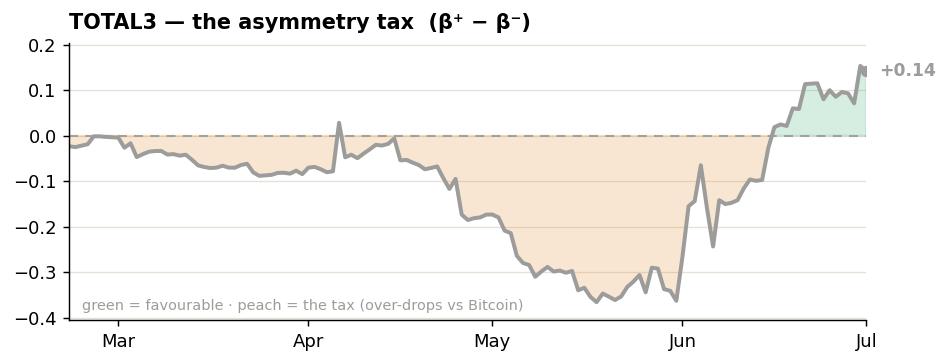
For three weeks the up/down split has run in the basket’s favor. This week altcoins captured 57 cents of every Bitcoin dollar gained and gave back only 42 on every dollar lost — about 1.3× more upside than downside. But on a magnitude basis the gap is flat versus 20 days ago, so there’s no contraction and no turn signal. The favorable tilt is a local-window reading on a thin sample of up-days, not a break in the long-run picture where altcoins usually give back more than they catch.
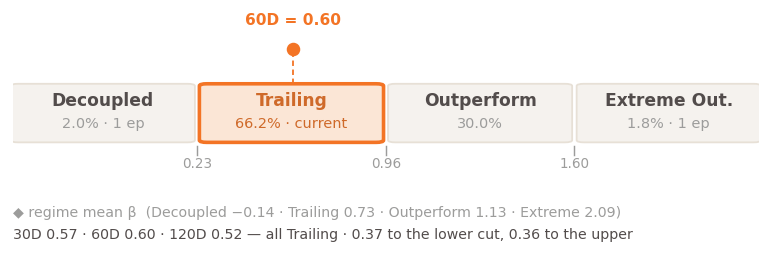
The basket sits mid-Trailing (regime mean 0.73), the dominant state at 66% of the sample.
🟢 This week’s Total3 Alt Tax is Chill.
ETH — Knife-edge on the Boundary
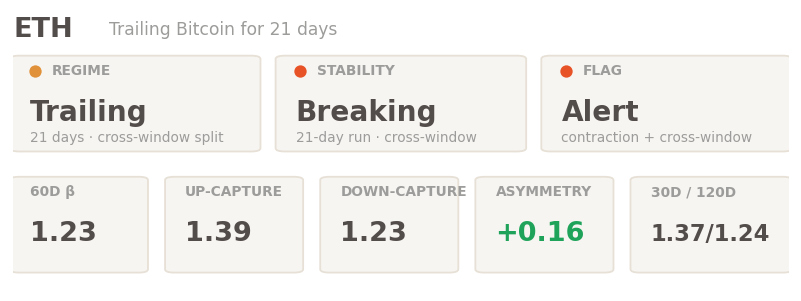
ETH is the desk’s knife-edge. The 60-day beta has held Trailing for 21 days, but it sits a hair under the 1.24 Trailing/Outperform cut while both the 30- and 120-day windows read Outperform — a cross-window split now in its fourth straight week. 35 of the last 60 days sit within ±0.03 of that boundary. Two instability conditions firing at once.
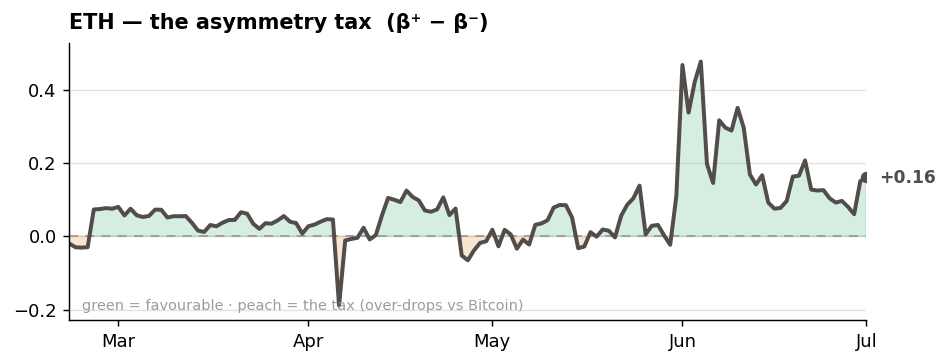
The asymmetry ran the favorable way — 139 cents up-capture against 123 down, about 1.1× more upside than downside. But the +0.16 gap sits inside both error bars (up-capture ±0.25, down-capture ±0.16), so it is statistically indistinguishable from symmetric. The 20-day gap has net-narrowed from +0.30 to +0.16, which trips the contraction flag — but the path bottomed at +0.06 and bounced, and week-over-week the gap actually widened. The narrowing is the early-June spike rolling out of the 20-day window, not fresh contraction.
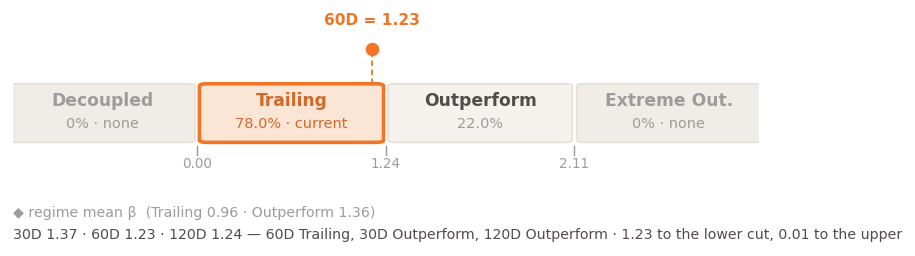
ETH runs a two-regime framework: Trailing (mean 0.96, 78%) and Outperform (mean 1.36, 22%). No Decoupled or Extreme Outperform regime has ever populated for ETH. The 60-day beta sits right on the 1.24 line that divides the two.
🟢 This week’s Ethereum Alt Tax is Chill
The Cross-section
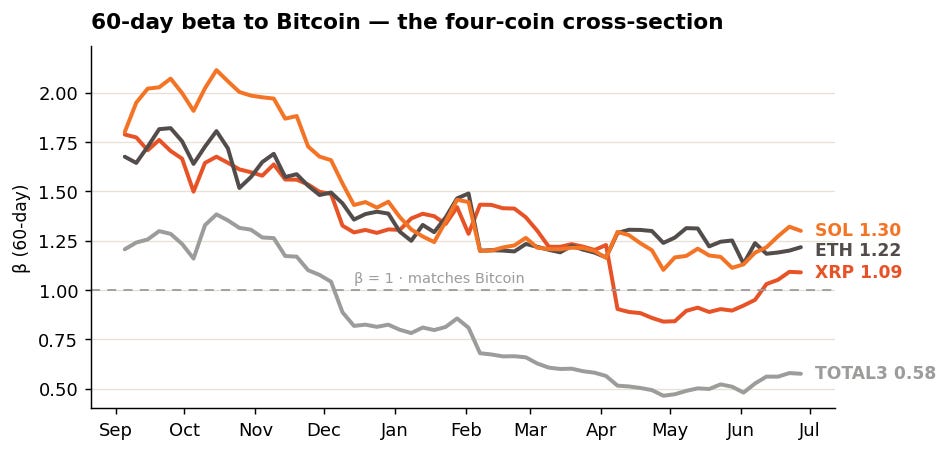
Read low-to-high: TOTAL3 deep in Trailing, XRP and ETH clustered around their boundaries, SOL alone out at 1.37. The spread is wide right now: nearly 0.8 of beta separates the altcoin basket from SOL, with ETH and XRP threading the β = 1 line that marks parity with Bitcoin.
Bitcoin Dominance
Bitcoin dominance — BTC.D, Bitcoin’s share of total crypto market cap — sits at 58.3% and is falling, trading below both its 50-day (59.4%) and 150-day (59.4%) averages. Falling dominance means Bitcoin is ceding market share to the rest of crypto.
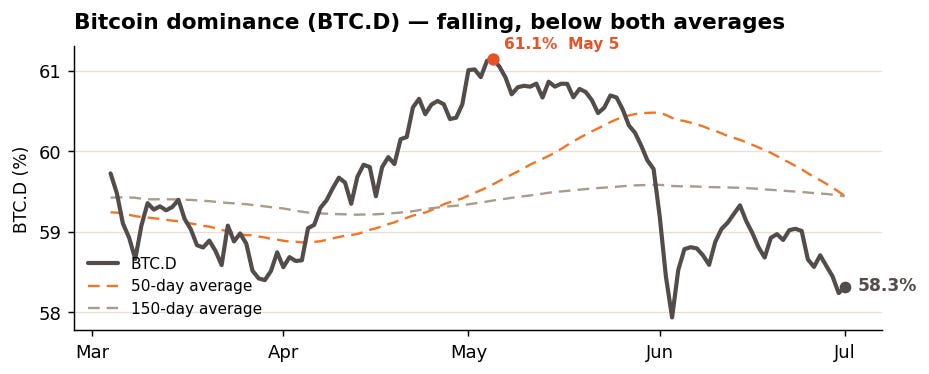
The basket disagrees with itself. Dominance is falling — market share drifting toward altcoins — while the aggregate altcoin beta (TOTAL3) still reads Trailing, altcoins underperforming Bitcoin move-for-move. The two point opposite ways. We flag the disagreement; we do not call which side resolves.
🔴 This week’s Bitcoin Dominance is bearish.
What’s Solid, What’s Soft
Solid. The regime tags and the long persistences are the firmest reads: TOTAL3’s Trailing has all three windows agreeing at 205 days, SOL’s Outperform is 835 days deep, and the symmetric and down-capture standard errors are tight across the desk (13–19% of estimate).
Soft. SOL’s asymmetry collapse rests on a noisy up-capture leg — its up-capture standard error is 42% of the estimate, so the direction of the contraction is clear but its magnitude is soft, and our Inference Auditor dissents on how much to read into it. ETH’s favorable tilt (+0.16) sits inside both its error bars, statistically indistinguishable from symmetric, and its beta has spent 35 of the last 60 days within a few hundredths of the boundary, so the Trailing tag is fragile. XRP’s lead is real but only 16 days old. The tail regimes everywhere are thin — one to three historical episodes each, none at all for ETH — so any read on Decoupled or Extreme Outperform is a small-sample read. And where a flag is firing (SOL and ETH), the relationship is moving fast enough that any read beyond about three weeks is on shaky ground.
The Beta Desk measures the empirical beta relationship between each tracked coin and Bitcoin — directional up- and down-capture, the regime it implies, and how stable that regime is. We report what the data shows and flag what’s uncertain; we do not forecast price or suggest you take positions. The trading view is yours to add. — The Beta Desk, Hayloo Unchained.
On-Chain Tape
Bitcoin is testing a floor before building a bottom, and this week the test got more constructive. Glassnode’s Long-Term Holder net position change is back positive, the Accumulation Trend Score has broadened, and — other than a week ago — both the Binance and Coinbase spot orderbooks have turned bid-heavy. Dealer gamma has turned supportive in the low-$60,000 region where dealers hedge by buying weakness. That is a materially more constructive surface than the prior week. Underneath it, the exchange-traded fund (ETF) net flow deteriorated to roughly −$1.3 billion on the week, running the mirror image of a bottom signal at monthly scale; Net Unrealized Profit/Loss (NUPL) deteriorated to −16.7%, deeper underwater; and no Short-Term-Holder is chasing mature supply from long-term hands.
The share of supply in profit fell to 48.0%, below half and into capitulation territory; the Realized Profit/Loss Ratio (RPLR) breached its low band to −1.2, loss realization firmly dominant; spot CVD sits at −$204 million, sellers dominating the tape; and the options 25-delta skew rose above its high band with the 14-day put/call ratio at a one-year high, downside protection firmly bid.
Selling pressure is being absorbed by patient capital, a floor being tested, not built. That final washout is the flush Hayloo’s book is positioned to harvest, and it poked through this week — the $57,779 low was inside the dealer long-gamma zone — and got bought back above $60,000.
Hayloo’s tape carries a genuine two-way tension into next week, and we hold it rather than resolve it. The break below the $60,000-to-$64,000 gamma band is the flush setup the bears wait on; the same tape shows crowded shorts and bids stacking underneath, which is the squeeze setup that runs against the bears.
🔴 This week’s on-chain read is accumulation beneath a deteriorating substrate — a floor tested, not built, the dollar the dominant tell against it.
Hayloo’s Perp Book
Size and direction. Our perp book is net short. Wallet equity is up 5.8% from last week.
Funding rate carry — income, not cost. The smoothed carry governor reads plus $200,631 annualized, +2.08% of equity — income.
Next levels that fire. Downside: $55,000 Bitcoin and $55 Solana, both Long Add / Short Take-Profit; on contact the Bitcoin leg stages across the $55,000/$50,000/$45,000 ladder rather than loading at the first level, and the heavy short-harvest and long-build target is a $45,000 wick. Upside: $77’500 Bitcoin True Market Mean (TMM). The reclaim that reverses any of it is a weekly close back above the $60,000-to-$64,000 gamma floor and the $62,500 200-week moving average with spot demand attached.
Position vs. thesis. The book is positioned for a bear-continuation.
🔴 Hayloo’s perp book is net short, collateralized by spot long.
Macro Tape
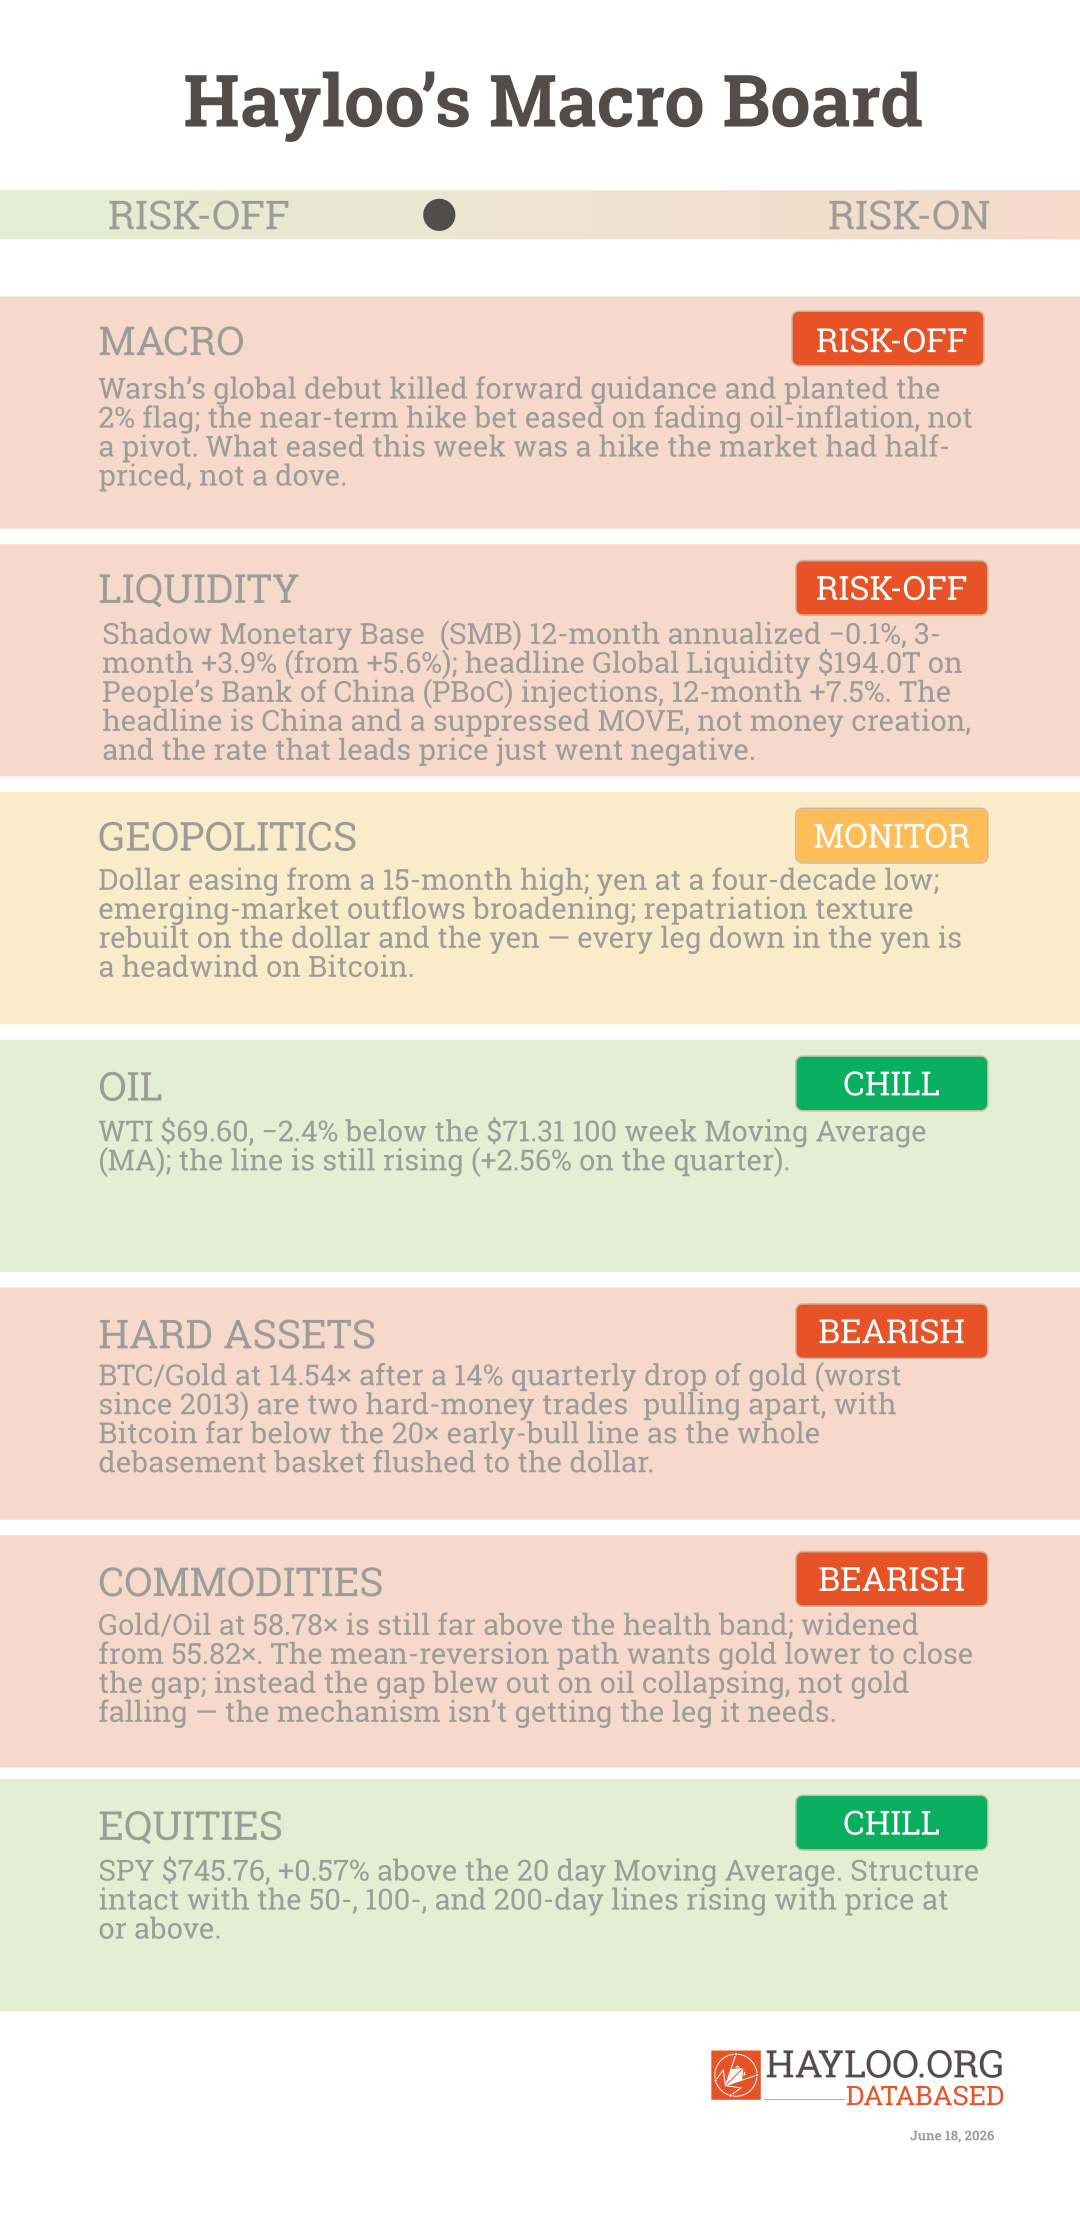
The dollar is the whole macro story, and this week Kevin Warsh made his global debut without softening it. He killed forward guidance, said prices are still too high, and planted the flag on 2% — the hawkish anchor, not a pivot.
What eased was the near-term hike bet, and it eased because the oil-driven inflation scare is fading, not because Warsh blinked; the relief bounce is the market letting a little air out of a hike it had half-priced.
May headline Personal Consumption Expenditures (PCE) inflation ran 4.1%, a three-year high catching the peak of the oil-war spike, with core landing in line at 3.4%, and spending and income both ran +0.7% — the firm real economy pulling money out of financial assets that the liquidity read now leans on.
The reaction function underneath survived the week intact and got harder to dislodge: the Supreme Court ruled the Fed’s independence stands, insulating the Warsh reaction function from the White House, and Citadel Securities — the firm that sees everyone’s order flow — told the market it is underpricing his determination.
The dollar took the message and holds it. It sits near 101, easing from a 15-month high after its best month in a year, with the yen at a four-decade low, broken through 162, and Tokyo talking up prior intervention — the dollar-up, everyone-else-takes-the-adjustment regime at its sharp end. That regime transmits straight through to the book: dollar-yen and Bitcoin are running near-perfectly inverse, a correlation around −0.9, so every leg down in the yen is a headwind on Bitcoin. This is capital coming home to the dollar, not new money entering the system.
🔴 This week’s macro tape holds the risk-off regime, and the dollar is the dominant weight on the board.
Geopolitical Tape
The worst weekend since the Iran deal ran two nights of US strikes, Iran hitting Bahrain and Kuwait, and a tanker struck — and it still resolved toward talks by Sunday, with envoys to Doha. The talks are indirect, nobody in the same room, no deal on the table; Iran’s own line is that it controls the strait and charges tolls, by force if it comes to that.
That is the asymmetry sitting under the ceasefire: the strait is cheap to close on one drone campaign, expensive to reopen.
🟠 This week’s geopolitical landscape remains unresolved, with the strait one drone campaign from repricing.
The Oil Tape
WTI printed a four-month low near $68 on Doha “positive progress” and a swing back to oversupply, leaving the spot price at $69.60 — 2.4% below its 100-week moving average at $71.31. Iranian exports have run past 40 million barrels since the blockade lifted, Russian shipments sit at records, four Gulf producers pump near three-quarters of pre-war volume, and Morgan Stanley cut its forecast twice in two weeks.
🟢 This week’s Oil Price broke below a still-rising line.
The Equity Tape
The equity surface is the key macro sword over Bitcoin, and this week it did two things at once. The structural picture is intact and publishable: the 50-, 100-, and 200-day lines are all rising with price at or above them, and persistence sits at zero at every horizon — the S&P 500 is currently above all four of its moving averages. The tactical line rolled over underneath that: the 20-day is now falling, with price spending 67% of the trailing month below it, the chop eroding the short-horizon smoother even as the longer lines rise and the cushion above them compresses. The last severe-stress pillar in reach — the run of consecutive closes below the 20-day — reset to zero when the index reclaimed its 20-day on June 30 and held it through the July 1 chip washout, a session that took Micron and Sandisk down 10% and got absorbed.
Equities printed their best quarter in six years into quarter-end, the equal-weight S&P set a record the same day the cap-weighted index closed below its 20-day for a fifth session — a rotation out of chips, not a market breaking.
🟢 This week’s equity structure holds
Hard Assets
The debasement basket flushed together, and that is oil collapsing and gold coming down at once, not a flight to or from real assets. BTC/Gold sits at 14.54× — below the 20× early-bull confirmation, the two hard-money trades still pulling apart.
Gold fell 14% on the quarter, its worst since 2013, a temporary Chinese-liquidity squeeze plus dollar strength.
Gold/Oil, meanwhile, blew out to 58.78× because oil collapsed, not because gold fell — the mechanism wants gold lower to close the gap and is not getting it.
The Strategy reflexive loop crossed a structural line this week. STRC trades at $87.46, $12.54 below the par it was sold at. On June 29 the company opened the door to selling up to $1.25 billion of that Bitcoin, paired with buybacks and a fatter dividend, and the market took the cash-and-backstop read as a floor for exactly one day before un-taking it. The treasury cohort that was a permanent bid is now a supply question mark. We do not escalate the loop — announced selling is not printed selling — but it is no longer substrate; it is on the tape.
🔴 This week’s hard-asset ratios stay bearish; the whole debasement basket flushed to the dollar, and the treasury cohort turned from bid to supply.
Liquidity Tape
Aggregate Global Liquidity edged to $194.0 trillion with its three-month rate accelerating to +13.6%, and it means less than it looks, because it is the People’s Bank of China resuming net injections — the first since the Middle East conflict began, timed to the US–Iran memorandum — plus a MOVE index pinned at 67 against a March average near 90, lifting the collateral multiplier.
Under it, the Shadow Monetary Base decelerated for a second consecutive weekly print, to +3.9% from +5.6% on the three-month rate, and its twelve-month rate crossed into negative territory at −0.1%.
🔴 This week’s liquidity tape points to risk-off; the rate that leads just went negative.
Forward Thesis
The read for the next four to twelve weeks is unchanged: lower-to-choppy, with the deepest price-headwind window still late August 2026 — the late-May Shadow Monetary Base trough plus Howell’s roughly thirteen-week transmission lag, a window the three-month improvement does not move.
The flush is gated on a macro catalyst strong enough to break the dealer long-gamma floor — which Bitcoin poked through this week and got bought right back, the definition of a floor tested, not built.
One reflexive risk carried in Hard Assets belongs on this board too. Strategy’s funding loop crossed a structural line: the company opened the door to selling up to $1.25 billion of its Bitcoin against a $14 billion unrealized loss, and a miner moved coins out to fund a data-center pivot — the treasury cohort that was a permanent bid turning into a supply question. We do not escalate it — announced selling is not printed selling — but it has moved from substrate to the tape, and it resolves the day the loop prints a sale or the discount to par closes.
What would change our mind, each against its current value:
1. Shadow Monetary Base three-month annualized clearly positive and non-base-effect, with the twelve-month rate turning back up at the same time.
2. The RPLR sustained above 2.0 across multiple weeks, with confirmed accumulation.
3. A clean weekly close above $64,000 with sustained spot demand.
4. Exchange-Traded Fund inflows of $1.5 billion a week for two consecutive weeks.
5. Ten consecutive S&P 500 closes below the 20-day moving average — the escalate side.
If two of these appear at once, we re-evaluate the book on the next weekly.
Watchlist
- BTC at $57,779–$58,000 — the intra-week low, inside the dealer long-gamma zone; the flush poked through here and got bought back. A weekly close that holds below, with Exchange-Traded Fund flows still bleeding, is the second-leg confirmation. Monitoring escalates to daily on re-approach.
- BTC $60,000–$64,000 gamma floor / $62,500 200-week moving average — the reclaim level. A weekly close back above, with Binance Cumulative Volume Delta joining Coinbase, is the relax-side signal.
- SOL at $90 — the first Solana resistance above the blended short. A sympathy rip with Bitcoin or a continued Outperform run puts it in play.
- ETF flow magnitude and breadth — running the mirror image at −$4.51 billion in June, the record month; two weeks of $1.5 billion-plus net inflows forces re-evaluation.
- Howell’s SMB next print and the MOVE index — the three-month rate is +3.9% and decelerating, the twelve-month negative; a three-month move below −3% sustained escalates the read. A MOVE re-spike above 80 reverses the multiplier expansion carrying the headline liquidity number.
- GOLD/OIL — contracting toward 20 or blowing out beyond 60? The gap widened to 58.78× on oil collapsing, not gold falling.
- STRC and Strategy — the reflexive loop at $87.46, $12.54 below par, $14 billion underwater, the sell door now open; printed selling, not announced, is the escalation.
- BTC.D — dominance below the 100-week moving average still needs directional input, and now disagrees with the basket’s own beta on which way share is moving.
*The information is provided for information purposes only and on the basis that it will not be relied upon. No information contained herein constitutes a personal recommendation or investment advice.*
*The information (including any expressions of opinion or forecast) has been obtained from, or is based on, sources believed by the author to be reliable, but are not guaranteed as to their accuracy or completeness and should not be relied upon. The information is provided without obligation on the part of the author and on the understanding that any person who acts upon it or changes his investment position in reliance on it does so entirely at his own risk. The information does not constitute an offer to buy or sell or an invitation to make an offer to buy or sell any financial instrument.*
*Information is current only as at the date it is first posted and may no longer be true or complete when viewed by you. All information may be changed or amended without prior notice.*
*No representation, warranty or undertaking is given as to the accuracy or completeness of the information by the author and no liability is accepted by the author for the accuracy or completeness of such information. In no event will the author be liable to any person for any direct, indirect, special, or consequential damages arising out of any use of the information, including, without limitation, any lost profits.*
*You should be aware that the Internet is not a completely reliable transmission medium. The author does not accept any liability for any data transmission errors such as data loss or damage or alteration of any kind, including, but not limited to any direct, indirect or consequential damage, arising out of the use of the product or services referred to herein.*
*The materials provided here including text, photographs and other images, are protected by copyright and/or other intellectual property rights. All copyright (and any other intellectual property rights) in these materials is either owned by the author, or is used by the author under licence.*