

A measure of forward-looking global liquidity printed at a much finer grain: low noise, high signal.
Global Liquidity is money’s print run. Every financial market depends on it, whether you trade stocks, gold, crude, or coins. Five central banks run the presses, in Washington, Frankfurt, Tokyo, Beijing, and London, and that’s the cash. Eight governments crank out bonds by the trillion, and that’s the collateral. Whoever holds a bond can take it to a lender and walk away with cash. Add the two together, and you have Hayloo’s Print Run™, a measure of forward-looking global liquidity printed at a much finer grain: low noise, high signal.
M2 is a homemade number, stapled together by whoever draws the chart.
Most traders make do with M2, a count of the public’s liquid money. In crypto, the standard chart lays Bitcoin over a line called global M2. That line is a homemade number, stapled together by whoever draws the chart. They pick the economies, four on one version and 21 on another, never mind that the Federal Reserve (Fed) and the European Central Bank don’t mean the same thing by M2.
When the dollar falls, the same amount of foreign money comes out as more dollars in M2, even though nobody has created a cent.
M2 represents liquid money: notes and coins, checking and savings accounts, small time deposits, and retail money funds. There isn’t a single bond in it, so M2 can’t see what lenders will lend against bonds, or how much less they lend when the bond market takes fright. And on the global M2 chart, each M2 gets converted into dollars, so when the dollar falls, the same foreign money comes out as more dollars and the line climbs. Nobody has created a cent.
Print Run™ is Hayloo’s exclusive in-house read on Global Liquidity, and it starts with what M2 leaves out.
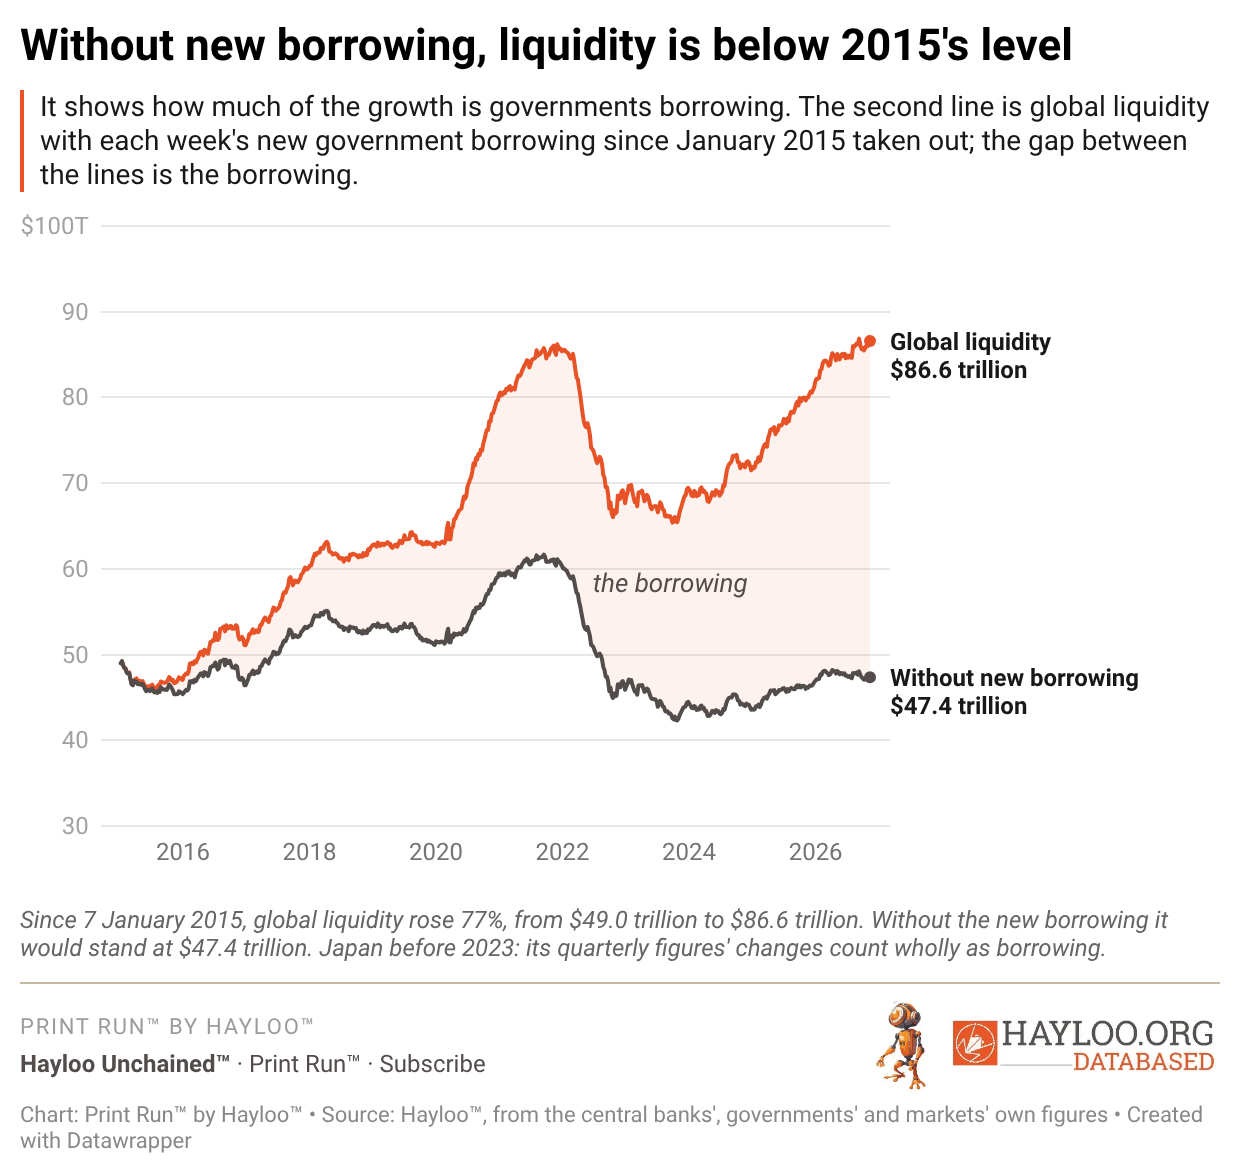
Print Run™, Hayloo’s exclusive in-house read on Global Liquidity, starts with what M2 leaves out. That turns out to be the front-page story: take away what the eight governments have newly borrowed since 2015, and Global Liquidity stands about where it did then. M2 holds none of that.
A new week of Hayloo’s Print Run™ goes to press every Thursday night, right after the Federal Reserve publishes its weekly balance sheet.
Our sources are the central banks’ and governments’ own figures, which are public. We add them up into one number, in U.S. dollars, and a new week goes to press every Thursday night, with back issues to October 2014. The first eight charts show the number and take it apart, down to which central bank moved and how much of the growth was governments borrowing. Our number is counted in dollars too, so one chart shows what the dollar’s move did on its own. Another puts a dollar figure on bond fear, our name for a bond market that has started to ask for more collateral against the same dollar loan.
The next eight charts hold the number up against Bitcoin, Ether, the S&P 500, gold, and oil, and they take the questions a trader would ask. Which markets have followed liquidity, and how many weeks late? Which have run ahead of the money behind them? How much of each rise was only more money? And what do the back issues say Bitcoin, the S&P 500, and gold did after weeks like this one? Three more charts follow stablecoins, the cash crypto buys with, and ask whether that cash still grows with liquidity once new users are taken out. The last chart is the receipts: every figure behind the week’s number, with its date and the website to check it on.
Hayloo’s Print Run™ and its’ 20 weekly charts are FREE for subscribers.
Disclaimer
The information is provided for information purposes only and on the basis that it will not be relied upon. No information contained herein constitutes a personal recommendation or investment advice.
The information (including any expressions of opinion or forecast) has been obtained from, or is based on, sources believed by the author to be reliable, but are not guaranteed as to their accuracy or completeness and should not be relied upon. The information is provided without obligation on the part of the author and on the understanding that any person who acts upon it or changes his investment position in reliance on it does so entirely at his own risk. The information does not constitute an offer to buy or sell or an invitation to make an offer to buy or sell any financial instrument.
Information is current only as at the date it is first posted and may no longer be true or complete when viewed by you. All information may be changed or amended without prior notice.
No representation, warranty or undertaking is given as to the accuracy or completeness of the information by the author and no liability is accepted by the author for the accuracy or completeness of such information. In no event will the author be liable to any person for any direct, indirect, special, or consequential damages arising out of any use of the information, including, without limitation, any lost profits.
You should be aware that the Internet is not a completely reliable transmission medium. The author does not accept any liability for any data transmission errors such as data loss or damage or alteration of any kind, including, but not limited to any direct, indirect or consequential damage, arising out of the use of the product or services referred to herein.
The materials provided here including text, photographs and other images, are protected by copyright and/or other intellectual property rights. All copyright (and any other intellectual property rights) in these materials is either owned by the author, or is used by the author under licence.