


Tape of the Week
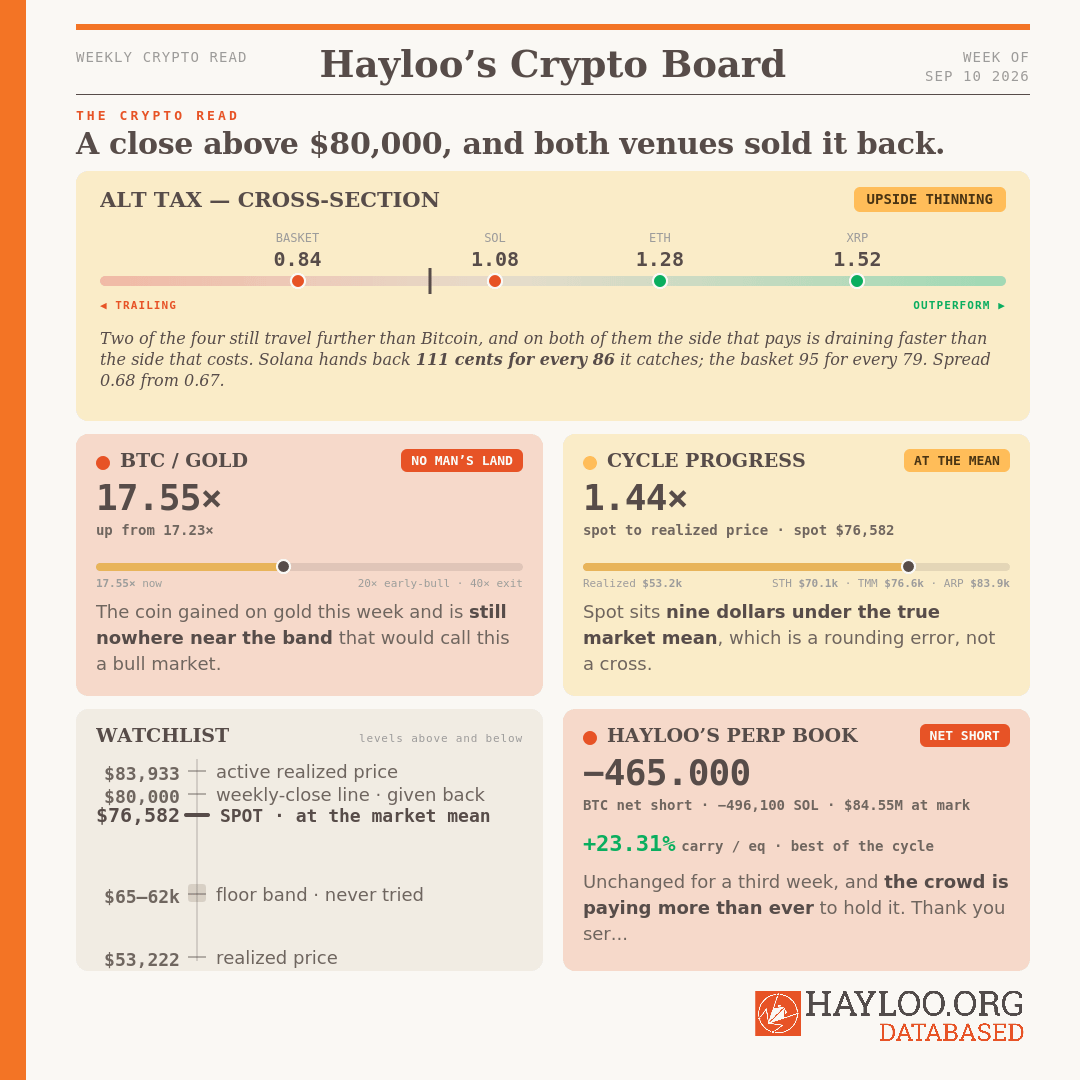
Bitcoin closed a week above $80,000 for the first time since May, and we were closely observing sustained spot demand. Demand did not come. Coinbase’s cumulative spot flow fell by $245.4 million and Binance’s fell by $387.2 million. The US bid from earlier in the week, likely into Clarity hopium or Warsh-dove rumors, has gone. This is not how sustained spot demand looks.
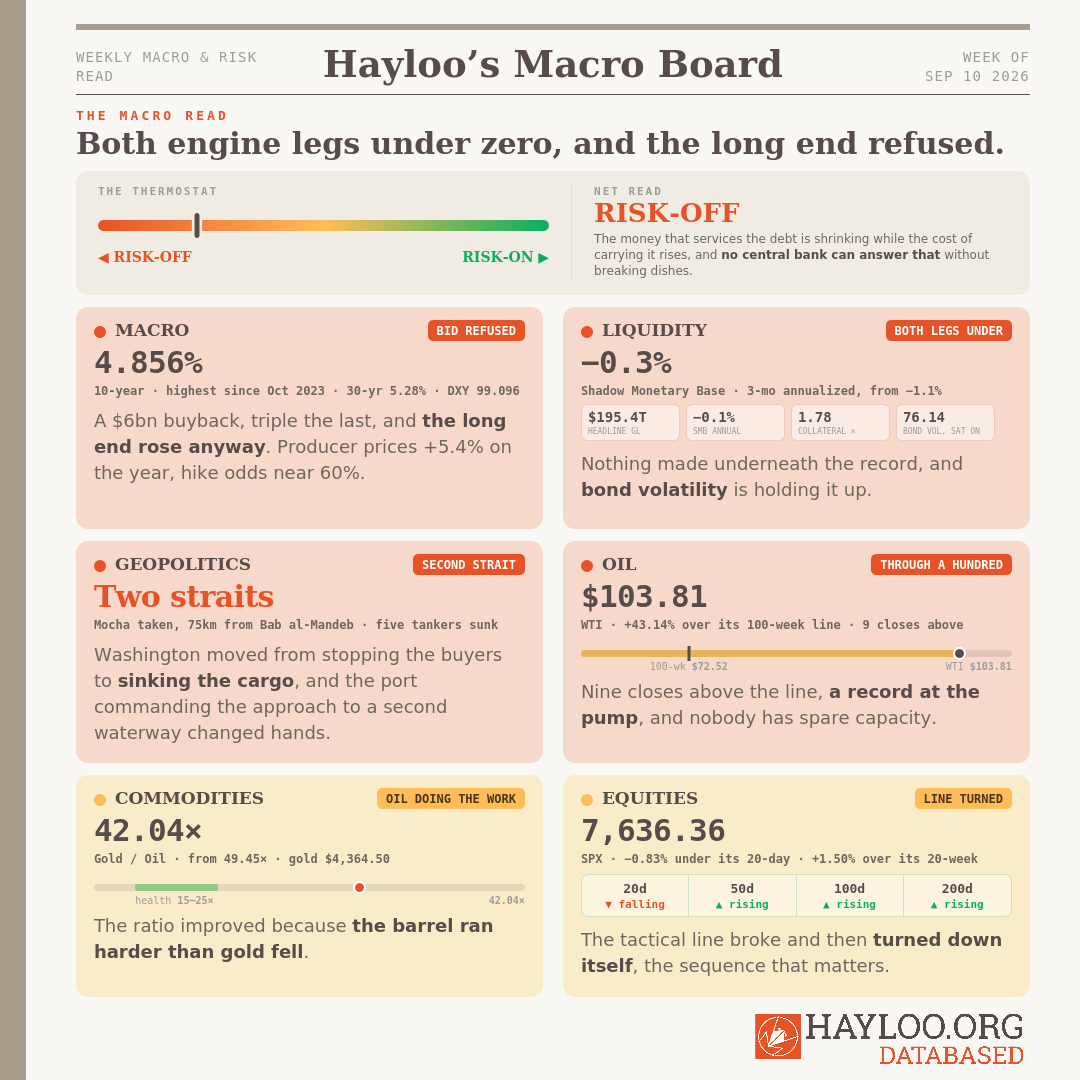
The Shadow Monetary Base, central-bank liquidity plus the collateral the system borrows against, measured by Michael Howell’s Capital Wars, printed both its legs under zero for the first time since mid-August: the three-month rate at −0.3% against −1.1%, the annual rate at −0.1% against +0.2%, and liquidity slipping to $109.4 trillion from a revised $109.5 trillion.
Overhead, the bitcoin sell-wall held. Three sources that do not share a method draw it in the same place, between $83,000 and $86,000: roughly 1.07 million coins of long-term-holder cost basis with the heaviest bucket near $85,000, a shelf of short liquidation levels that grew 21% since the August 19 squeeze while the whole liquidation map shrank by a third, and a spot fund complex that breaks even near $86,000 after 228 consecutive sessions below it. Spot printed a higher high than August on September 3 and stopped 1.5% short of the bottom of the band.
Then there is the absence, and it argues against our short position. Nobody is selling into that range high. Sell-side risk has fallen to 7 basis points a day against 16 at the August peak, and against 35 and 23 at the July and October 2025 highs. Long-term holders’ share of realized profit fell to 47% from 88%. The sellers up here are recent buyers, and even they are selling less.
The rest of the week came from the barrel and the long end. Brent reached $105.26 and American crude went through $100 for the first time since May, with the Houthis holding a Red Sea port 75 kilometres from Bab al-Mandeb and Saudi output at a 1990 low, while a Treasury buyback triple the size of the original intent failed to hold a ten-year that reached its highest since October 2023.
Hayloo’s crypto book did not trade. We remain short bitcoin and solana for a third week, with leveraged longs paying us 23.31% of equity annualized to sit still.
Liquidity Tape
The liquidity engine put both of its legs under zero. The Shadow Monetary Base, central-bank money plus the collateral the system borrows against, printed a three-month rate of −0.3% against −1.1% and an annual rate of −0.1% against +0.2%. Its level came in at $109.4 trillion from a revised $109.5 trillion, against a February peak above $112 trillion. The three-month rate improved by eight tenths of a point this week and is still under water. The annual rate crossed back below zero. All these numbers come from Michael Howell’s Global Liquidity Index (GLI).
Headline global liquidity set a record in the same week at $195.4 trillion, with three-month momentum picking up to 2.3% from 1.8%. The two halves of one measurement now point in opposite directions, and the man who built it says why in his own words: the benign funding background is volatility suppression, not liquidity creation.
The lever under that suppression is bond volatility. Our book reads it live at 76.14 against a 200-week line of 97.86, with 23 consecutive completed weekly closes under that line since April 5. The collateral multiplier did the work again at 1.78 from 1.77, which is what a quiet bond market pays you: smaller haircuts, more borrowing on the same collateral, and a headline that reads full while no new money gets made.
🔴 Both legs of the engine are under zero, and a record headline is standing on bond volatility that is artificially held down.
— Global Liquidity Director (Julian Harlow)
Macro Tape
The Treasury tripled the size of the operation and the long end went up anyway. A $6 billion buyback, against $2 billion originally, and the ten-year reached 4.856% on September 9, its highest print since October 2023. The thirty-year closed at 5.28% on September 9 against a completed weekly close of 5.24% from 5.22%. Scott Bessent said the expansion was aimed at cooling a fever in the bond market. We would label it a more severe disease than a bit of temperature.
The inflation print underneath it split in the worst direction for a Federal Reserve board that meets on September 16. Producer prices rose 0.4% on the month and 5.4% on the year, the core soft and the headline hot, and the gap between them is the fuel bill. Energy is not supposed to be the deciding variable at a meeting about services inflation, and this week it is. Hike odds sat at 58% to 60% early in the week, we’d put them higher.
The labour print did the same thing from the other side. Employers added 162,000 jobs against a 56,000 forecast and July was revised to a gain, so the number that was supposed to hand the doves their case handed the hawks a freebie instead.
Everyone else is tightening into the same barrel. The European Central Bank raised its deposit rate a quarter point to 2.5% with Christine Lagarde flagging inflation risks, the German ten-year printed a seventeen-year high inside a European selloff, and sources put the Bank of Japan at a quarter-point rise to 1.25% at the meeting ending September 18, with the yen already “out of control” (?).
🔴 A buyer who prints the currency tripled his bid, and the long end returned it to the sender.
— Chief Macro Strategist (Theodore Brennan)
Geopolitical Tape
The Houthis took the Red Sea port of Mocha and now sit about 75 kilometres from Bab al-Mandeb, the strait at the bottom of the Arabian peninsula. The Houthis do not need to close Bab al-Mandeb to charge for passage through it. For six months this war has been an argument about the strait at the top of the same peninsula, Hormuz, and now there are two of them. Ask the war-risk underwriters on Monday what a Red Sea voyage costs.
Washington changed method. For six months its answer to Iranian oil was to stop anyone from buying the cargo. On September 9 American forces destroyed five Iranian tankers, which takes those barrels off the water permanently instead of parking them, and those barrels are the one asset still funding Tehran.
Half a world away, Ukrainian drones hit Novorossiysk on the Black Sea, killing four, nine days after burning Ust-Luga on the Baltic. Novorossiysk and Ust-Luga are Moscow’s two seaborne exits for crude and for grain, and there is no third coast to move either cargo to.
🔴 Two straits are in play now, and the Houthis do not have to reach the second one to start charging for it.
— Geopolitical Intelligence Officer (Margaux Lindqvist)
Commodity Tape
Brent went to $105.26 and American crude passed $100 for the first time since May. West Texas Intermediate (WTI) sits at $103.81, 43.14% above its 100-week average line at $72.52, and the line itself has climbed 1.51% over thirteen weeks. Nine consecutive completed weekly closes now sit above it; the last bar under the line was July 3, at 2.33% below.
The pump ran ahead of the barrel again. American retail diesel set an all-time record at $5.85 a gallon on September 4. A haulier paying a record for fuel on September 4, while crude still sat below its July high, was being taxed by distillation capacity rather than by geopolitics, and no ceasefire fixes a refinery.
The supply side is being destroyed while the demand side firms into it. Saudi output fell to a 1990 low and Aramco halted operations at several southern energy facilities after attacks, with nobody saying how long they stay down. Chinese refiners are back looking for barrels at the same time American aircraft are sinking the tankers that carry them, and the hulls do not come back.
The cleanest measure of the strait anyone has published in a month came from a government’s accounts rather than a freight rate: Qatar posted its widest quarterly deficit in almost a decade because the closure shut its gas trade. Crude has found its way out of that water at a price; the liquefied cargoes have not.
🔴 Crude through a hundred, a record at the pump, and the exporter of last resort pumping at a thirty-six-year low.
— Inflation & Real Asset Analyst (Sienna Whitfield)
Hard Assets
Copper set an all-time London Metal Exchange high twice this week and a broad metals gauge printed a record with it, and the refined-copper tariff that is supposed to justify the move has still not been announced. A metal that sets an all-time high on an anticipated policy already contains the decision in its price, which turns the decision itself into a downside event.
Gold’s floor is still poured in Beijing. The metal reads $4,364.50, 0.49% above its own 20-week line, on a completed weekly close of $4,428.35. China’s central bank added the most gold to its reserves since 2023 in August, in the same week Beijing pushed 360 billion yuan into eight state-owned banks and insurers.
The ratios say what the vehicle question has been saying for two months. Gold over oil compressed to 42.04 barrels an ounce from 49.45, most of it from the oil side again, though gold gave back 2.7% since Tuesday as well. Bitcoin over gold rose to 17.55× from 17.23×, still under the 20× early-bull band this desk measures.
🟠 Records in copper, a floor in gold that Beijing keeps pouring, and the hard-money ratio still nowhere near its bull-band.
— Hard Asset Strategist (Marcus Vasquez)
Equity Tape
The S&P 500 sits at 7,636.36, 0.83% under its 20-day average line at 7,700.13, after closing beneath it on September 8 and 9.
Occupancy reads 38.10% below the 20-day line and zero below the 50-, 100-, and 200-day. What did change is the shape: the 20-day line has turned down, the other three still rise, and all four trajectories are negative, at −12.77, −9.03, −14.58, and −8.40 index points. Last week the lines were rising with falling slopes. This week the nearest one started falling. A car-crash in the making?
🟠 The tactical line broke and then turned down.
— Technical Analyst (Lukas Marchetti)
Our Short-Kill Condition Came in Half-Baked
Bitcoin closed a week above $80,000 for the first time since May, but Coinbase and Binance sold into it.
On-Chain Tape
The big fat bitcoin sell-wall between $83,000 and $86,000 we pointed at for months is drawn in the same place by three sources that do not talk to each other, and that is the finding of the week.
Roughly 1.07 million coins were acquired in that band, almost all of them by long-term holders, with the heaviest bucket near $85,000, and that block has barely moved in thirty days.
On the futures liquidation map, the shelf of short liquidation levels between $82,000 and $86,000 has grown 21% since the August 19 squeeze while the map as a whole shrank by a third, which puts it close to the largest share of modelled liquidation mass it has ever carried.
The American spot exchange-traded fund (ETF) complex, measured on the coins it has created since launch, breaks even in that zone: it has now closed below breakeven for 228 consecutive sessions, with its paper loss narrowing from about $18 billion in February to about $3.9 billion. Corporate treasuries break even near $80,500, and the average dollar deposited into the spot funds carries a cost basis of $81,776, so a bitcoin rally has several walls to clear before it even reaches the one that matters.
Spot printed a higher high than August on September 3, and stopped 1.5% below the bottom of the band. Underneath it the floor moved. Supply acquired between $76,000 and $82,000, mostly by recent buyers, has grown, while the accumulation floor between $62,000 and $65,000 thinned as coins bought there rotated out. The long-liquidation cluster between $60,000 and $63,000 is intact. The market rebuilt its floor directly beneath the price and left the wall where it was.
The part that argues against our short thesis is an absence rather than a number. Sell-side risk, which reads realized profit and loss against realized cap, has fallen to 7 basis points a day on a seven-day basis, less than half the 16 printed at the August peak and well under the 35 and 23 at the July and October 2025 highs.
Long-term holders’ share of realized profit fell to 47% from 88%, and September’s realized-profit spike came in under half of August’s. The sellers up here are recent buyers, and even they have slowed down.
🟠 The wall held with nobody selling into it.
— Capital Flow Analyst (Priya Sandoval) · Fundamental Research Analyst (Charlotte Donovan)
On our use of AI:
We’re a private crypto fund out of Switzerland. We built a Neurosymbolic Compound AI System for our own desk: it follows our strategies, it reads the news that affect our portfolio, it sits on a database going back decades, and brings math to our everyday emotions. We call it Hayloo. It’s our best hire. This Substack is compiled by Hayloo and written by us.
Humans have written machine-assisted for centuries. What never changes is who decides.
Nothing at Hayloo INC. was ever decided by a machine.
What we publish is what we defend as a team. When it’s wrong, it’s wrong because humans signed it.
Jordi Federer, Founder, Hayloo INC.
Hayloo’s Perp Book
Size and direction. Net short bitcoin and solana, unchanged in size and entry for a third week, and nothing traded. Bitcoin: 465 coins short from $78,749, both long legs closed since August. Solana: 496,100 coins short from a blended $93.42. At the mark that is $35.6 million of Bitcoin and $48.9 million of Solana.
Funding Rate Carry. The four-week smoothed mean reads $8,328 a day across sixteen populated sessions, which annualizes to $3.04 million and 23.31% of equity, the best rate of this cycle.
Position versus thesis. One of the three conditions that kills this trade printed half of itself, and that is the honest headline on our own perp book. Against it, the engine put both legs under zero, the wall held with spot a point and a half short, the barrel went through $100 while the long end refused a tripled bid, and Solana is now catching 86 cents of every dollar Bitcoin gains while handing back 111 of every dollar it loses (see Hayloo’s Altcoin Tax – Week 37).
What we are watching is the absence: nobody is selling into the range high, and that is the part of this tape that does not fit our position. Our size is unchanged and our conviction is lower than it was seven days ago.
On the spot side we sold 35,000 Solana and 8 million XRP on September 7.
— Lead Trader (Jordi Federer)
🔴 Short both legs, unchanged, and less certain than we were a week ago.
Ether’s Upside Is Draining Faster Than Its Downside - Hayloo’s Altcoin Tax Week 37

Hayloo’s Beta Desk. Beta is one number: when Bitcoin moves one percent, how far does the other coin move? Above one, the coin amplifies Bitcoin. Below one, it damps Bitcoin’s moves. The desk splits t…
Forward Thesis
Our direction reads lower to range-bound over the next four to twelve weeks with the balance of risk still down. What justifies full size is not the global liquidity engine topping. It is the regime it is topping inside. A liquidity top in disinflation is a pause the market can buy, and this one arrives with producer prices at 5.4% on the year, the thirty-year back at 5.24%, and a buyback that could not hold the long end.
The cost of carrying government debt is rising while the money to service it has stopped growing, so the policy response the market wants is the one that cannot come. Two dated liquidity pressure windows remain, early November and early December, and the path down runs from the true market mean at $76,591, where spot sits tonight, to the realized price at $53,222, which is 30.5% below spot and the level this trade has always been built toward.
What changes our mind, each against its current value.
A second completed weekly close above $80,000 with both exchange venues’ (Coinbase & Binance) seven-day flow positive on the same window. The price limb printed on September 6. The demand limb now has both venues selling on the trailing week. One limb from firing, and the closest any of the five has come.
Michael Howell’s next GLI-print with the three-month rate clearly positive and free of a base effect, while the annual rate turns up with it. Now −0.3% from −1.1%, with the annual leg back under zero. The three-month improved and the annual crossed the wrong way, so the pair is no closer than it was.
The S&P 500 taking up residence below its 20-day line instead of dipping under it and stepping back. Occupancy reads 38.10% on that line and zero on the 50-, 100-, and 200-day, with every trajectory negative, so the index is leaning without having moved in.
A sustained close beyond $86,000 with sell-side risk still subdued, which would say the wall was absorbed rather than respected.
Watchlist
Sunday’s Bitcoin weekly close against $80,000. The price limb is already met on the prior bar. A second close with Binance and Coinbase buying fires our warning flag.
Both venues’ seven-day spot flow on the same window. Coinbase at minus $245.4 million and Binance at minus $387.2 million, both selling on the trailing week, and the number to watch is Binance.
Bitcoin at $76,197. The first decision on the leg: harvest the short, add the long, or pass.
The band from $83,000 to $86,000. A settled close beyond $86,000 with sell-side risk still subdued is absorption rather than respect.
Solana at $104.53. Inside the escalation band and watched daily.
The August inflation print on September 11, the Federal Reserve on September 16, and the Bank of Japan on September 18. Hike odds near 60% with a barrel above $100 in the print, and a quarter point to 1.25% is the reported plan in Tokyo.
The September 25 quarterly expiry. The largest on the board, with open interest stacked above $80,000, which pins the tape under the wall for a fortnight.
Howell’s next print. The three-month is eight tenths of a point from zero and the annual leg is a tenth under it. The highest-information number of the coming weeks.
The thirty-year against 5.27%. A weekly close above it breaks the year’s ceiling, and the buyback has already failed once.
The Clarity Act cloture vote on September 15. A pass is the strength we sell XRP into.
The Team
Jordi Federer — Lead Trader. Owns the book and the publication. Sizing, staging, and every decision that moves capital.
Theodore Brennan — Chief Macro Strategist. Central-bank reaction functions, the dollar, and the rate path.
Julian Harlow — Global Liquidity Director. The liquidity engine, the collateral multiplier, and the transmission lag into price.
Margaux Lindqvist — Geopolitical Intelligence Officer. State behavior, escalation mechanics, and the tails that reprice commodities.
Marcus Vasquez — Hard Asset Strategist. Gold, the debasement basket, and the hard-money ratios.
Sienna Whitfield — Inflation & Real Asset Analyst. Energy, the inflation impulse, and the real-asset complex.
Priya Sandoval — Capital Flow Analyst. Fund flows, positioning, derivatives, and where the marginal dollar comes from.
Charlotte Donovan — Fundamental Research Analyst. On-chain cohorts, cost bases, and the structural read beneath the tape.
Lukas Marchetti — Technical Analyst. Market structure, moving-average regimes, and the levels that fire.
Disclaimer
The information is provided for information purposes only and on the basis that it will not be relied upon. No information contained herein constitutes a personal recommendation or investment advice.
The information (including any expressions of opinion or forecast) has been obtained from, or is based on, sources believed by the author to be reliable, but are not guaranteed as to their accuracy or completeness and should not be relied upon. The information is provided without obligation on the part of the author and on the understanding that any person who acts upon it or changes his investment position in reliance on it does so entirely at his own risk. The information does not constitute an offer to buy or sell or an invitation to make an offer to buy or sell any financial instrument.
Information is current only as at the date it is first posted and may no longer be true or complete when viewed by you. All information may be changed or amended without prior notice.
No representation, warranty or undertaking is given as to the accuracy or completeness of the information by the author and no liability is accepted by the author for the accuracy or completeness of such information. In no event will the author be liable to any person for any direct, indirect, special, or consequential damages arising out of any use of the information, including, without limitation, any lost profits.
You should be aware that the Internet is not a completely reliable transmission medium. The author does not accept any liability for any data transmission errors such as data loss or damage or alteration of any kind, including, but not limited to any direct, indirect or consequential damage, arising out of the use of the product or services referred to herein.
The materials provided here including text, photographs and other images, are protected by copyright and/or other intellectual property rights. All copyright (and any other intellectual property rights) in these materials is either owned by the author, or is used by the author under licence.
@JPARCVUE , your Yen-Carry trade article was fed to the machine, and the machine did what it’s designed to do: It filed it under “screened as already delivered”.
Meaning, it held the Yen-Carry trajectory since the topic came up in the news. Which is my value proposition to you: The beginning of Hayloo, the neurosynchronic compound AI system, was a mistrust in news.
Little did we know that we were going to build a machine that analyses faster than anyone could write “Good Morning Folks” on Substack.
We are enjoying a lead-time that, at the past peak of bitcoin, gave us 24 hrs. to act before the chatter came up online…
If you want the same lead-time, we are developing that product at scale as we speak… And it’s agnostic. No bitcoin needed. It works for stocks as well.