


Liquidity Tape: The Money Machine Is Running on Fumes
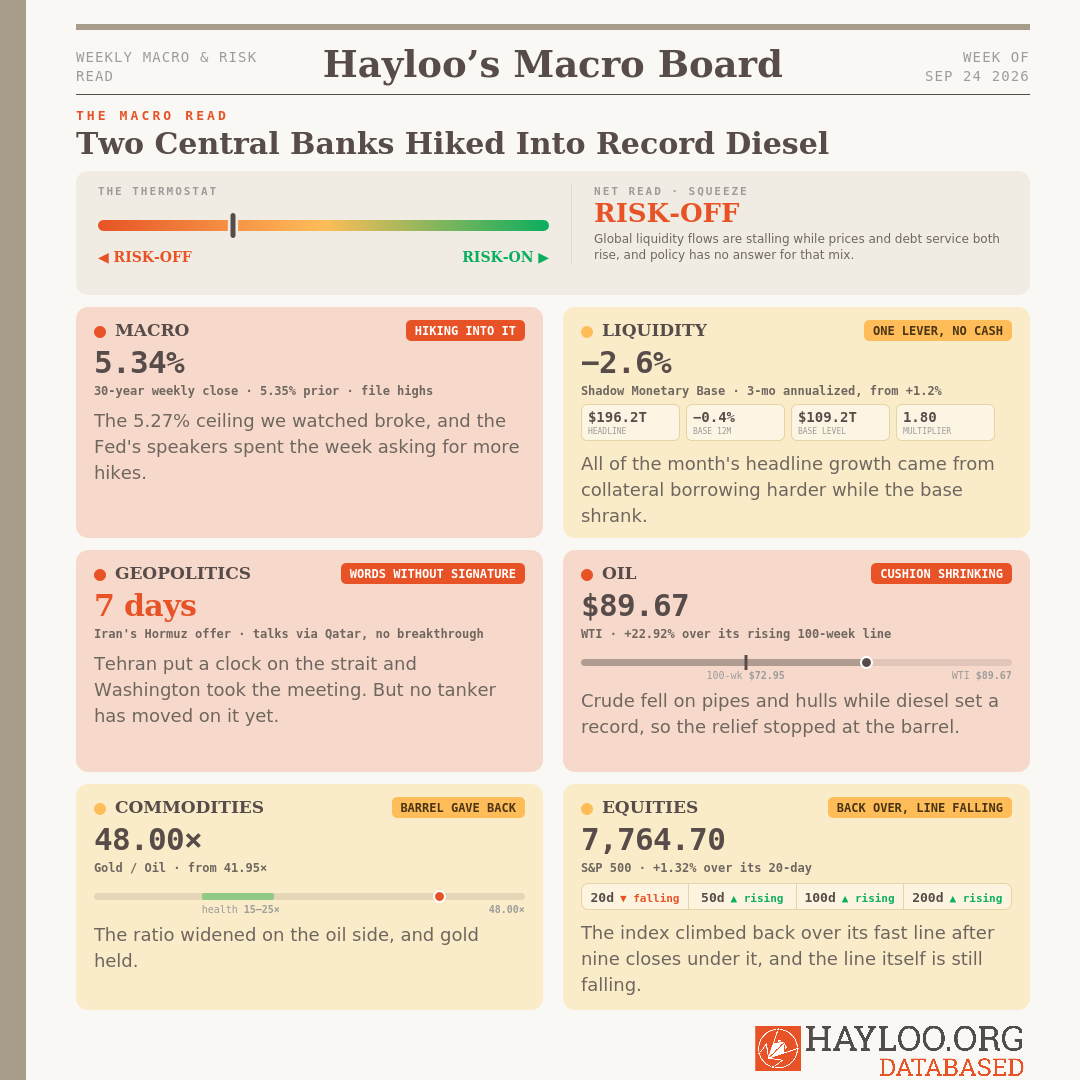
Global liquidity set a record at $196.2 trillion in Michael Howell’s September 22 Global Liquidity Index (GLI) update, and the Shadow Monetary Base under it fell for a third straight week. The base, central-bank money plus the collateral the system borrows against, slipped to $109.2 trillion from $109.4 trillion. Its three-month rate went to −2.6% from +1.2% and its annual rate to −0.4% from −0.1%, so both legs are negative for the second time this month. The headline’s three-month rate picked up to 4.3% from 3.2%.
We ran the split from the weekly rows of Howell’s own table. From August 21 to September 18 the headline rose 0.25% and the base fell 0.36%, and the collateral multiplier, headline over base, moved to 1.797 from 1.786. Howell puts it at 1.80, the highest in his records back to 2010. The month’s headline growth came entirely from each dollar of base carrying more borrowing, with no new money.
The multiplier rests on quiet bonds. The MOVE index (the Merrill Lynch Option Volatility Estimate, the market’s price for Treasury swings) touched 84 before the Fed’s September 16 decision and fell back to 76 after it, inside the 70-to-80 range it has held since April and well under its average near 100 since 2022.
Howell’s September 20 essay puts a price on that calm. Advanced-economy debt runs at about twice system liquidity. Moves above roughly 2.2 times have come before financial stress, and moves toward 1.8 times have come with bubbles. The first warnings on his list are repo spikes and jumps in bond volatility, with wider credit spreads confirming later. A record multiplier held up by suppressed bond volatility sits on the first item of that list.
The Hayloo team reads the record liquidity number two ways. The Global Liquidity Director reads a headline standing on one lever over a shrinking base as a plateau. The Capital Flow Analyst points to the series Howell charts the headline against, world equities about a quarter ahead, where the headline’s three-month growth just accelerated, and reads support for risk assets into the fourth quarter. The lever settles it: a MOVE close above 100 pulls the multiplier down, and with the base already shrinking, the headline follows.
🟠 A record headline on quiet bonds, over a base that shrank a third week.
— Global Liquidity Director (Julian Harlow)
On our use of AI:
We’re a private crypto fund out of Switzerland. We built a Neurosymbolic Compound AI System for our own desk: it follows our strategies, it reads the news that affect our portfolio, it sits on a database going back decades, and brings math to our everyday emotions. We call it Hayloo. It’s our best hire. This Substack is compiled by Hayloo and approved by us.
Humans have written machine-assisted for centuries. What never changes is who decides.
Nothing at Hayloo INC. was ever decided by a machine.
What we publish is what we defend as a team. When it’s wrong, it’s wrong because humans signed it.
Jordi Federer, Founder, Hayloo INC.
Macro Tape: The Thirty-Year Kicked the Door Down
The Fed raised its range to 3.75%–4.00% on September 16, and its regional presidents spent the week arguing for more. St. Louis’s Alberto Musalem said further increases may be needed and policy may still be stimulating the economy. Richmond’s Tom Barkin said elevated pressure risks becoming entrenched. Chicago’s Austan Goolsbee said the Fed cannot ignore repeated supply shocks and may have to cause hardship. Minneapolis’s Neel Kashkari said the pressure has broadened beyond oil. Traders are buying protection against the Fed hiking less than priced and moving money into short-dated Treasuries, and Goldman Sachs expects another hike in October.
The ceiling our September 10 watchlist carried at 5.27% broke. The thirty-year’s weekly close was 5.35% for the week of September 11 and 5.34% for the week of September 18. Pimco says thirty-year yields above 5% are leading it to trim its underweight, and Canada sold long bonds at the highest yield in 19 years.
Abroad the week added tightening. The Bank of Japan went to 1.25% on September 18 on a 7–2 vote, and the dollar went above 157 yen on the split. Economists expect a final European Central Bank hike in December.
The real economy gives them no reason to stop. U.S. initial jobless claims were 196,000 for the week to September 12. The Philadelphia Fed’s factory index fell to 37.8 from 47.4 and August manufacturing output slipped 0.3%. But Germany’s and France’s September activity beat, U.K. retail sales rose 0.5% in August, India’s flash survey accelerated, and South Korea’s early-September exports set a record. Demand does not need cuts. And a strong real economy pulls money out of financial markets.
The desk splits on crude. The Chief Macro Strategist reads its drop from $101.61 on September 16 to $89.67 on September 22 as the first input in months that gives the Fed room, which would ease the squeeze before year-end. The Inflation & Real Asset Analyst reads the record diesel price on the same tape as the committee’s real problem, and Kashkari’s line as proof the Fed sees it. The next consumer and producer price prints settle it, along with whether diesel follows crude down.
🔴 Two central banks hiked into a supply shock, and the long bond set weekly closes beyond health.
— Chief Macro Strategist (Theodore Brennan)
Geopolitical Tape: Tehran Set a Seven-Day Clock and Washington Called
Iran put a clock on the strait on September 22. A senior Iranian official said Tehran can reopen Hormuz within seven days if Washington eases military pressure and lifts its blockade of Iranian ports. The same day Donald Trump repeated his annihilate-or-deal framing at the United Nations General Assembly, and his envoys Steve Witkoff and Jared Kushner spent three hours with Iranian officials through Qatari mediators. By September 23 no breakthrough had been reported, and the strait is still shut.
Ukraine fired more than 1,000 drones at Russia on the night of September 19 and hit the Moscow Oil Refinery, and Russia is set to extend its ban on most diesel exports. Kyiv’s strikes now show up at American pumps.
🔴 Washington took the meeting and Tehran named its price. The strait stays shut.
— Geopolitical Intelligence Officer (Margaux Lindqvist)
Commodity Tape: Crude Crashed, Diesel Partied, and Nobody Got Relief
West Texas Intermediate fell to $89.67 on September 22 from $101.61 on September 16, and the war did not end. It still sits 22.92% above its 100-week line at $72.95, and the line has climbed 2.21% over thirteen weeks from $71.37. Ten completed weekly closes now sit above it, the latest $95.89 for the week ended September 20.
What moved the barrel was plumbing. Saudi crude has been loading ship-to-ship off Oman’s Sohar port since the East-West pipeline shut on September 11. Aramco told Asian refiners they will soon load at Yanbu on the Red Sea again, and on September 23 the kingdom moved to restart the pipeline. The Hormuz counts disagree: shipping data reported by Reuters showed a dozen commodity vessels through over the September 19–20 weekend against 35 the weekend before, while a U.S. regional commander said oil and liquefied natural gas shipments over the past two weeks were the highest in six months.
U.S. retail diesel topped $6.50 a gallon on September 21, a record, on crude’s fourth straight down day, after setting a record at $5.85 on September 4. The refinery constraint now sits in Russia, in the Gulf, and in the U.S. itself, and a cheaper barrel does not reach a freight bill. Qatar’s central bank governor says its gas plants could take two to three years to repair, and marine insurance costs are up 30% to 40% on the year, per the insurer AXIS.
🔴 Crude lost almost twelve dollars on pipes and hulls while diesel set a record, so the relief doesn’t reach freight cost.
— Inflation & Real Asset Analyst (Sienna Whitfield)
Hard Assets: Bitcoin Touched 20× Gold and Nobody Rang the Bell
Gold held while oil moved both ratios. The metal reads $4,304 on our live mark, 0.27% under its 20-week line, and its completed weekly close of $4,385.89 sits 1.63% above that line.
Beijing is still the buyer. China’s gold imports passed 1,000 tons this year, and the yuan held at 6.709 per dollar in Howell’s cross-rates while the dollar firmed against every other major. New York copper futures set an all-time high on tight Chinese supply.
Gold over oil widened to 48.00 barrels an ounce from 41.95 a week earlier, and the move came from the oil side. That is more than twice the healthy long-run level of about 20.
Bitcoin over gold reads 20.02× on our live marks, from 17.86× a week earlier, the first print at the 20× line this desk calls early-bull. On completed weekly closes, $81,169 over $4,385.89 reads 18.51×. The Hard Asset Strategist calls the line crossed only on a weekly close.
🟠 Gold held, oil widened the ratio, and Bitcoin reached the 20× line on live marks but not on a close.
— Hard Asset Strategist (Marcus Vasquez)
Equity Tape: AI Went Shopping in the Junk Aisle
The S&P 500 spent nine straight sessions under its 20-day line into September 18, then closed September 21 at 7,764.70, 1.32% above the line at 7,663.41 and 0.44% under its August 13 high of 7,798.99. The Nasdaq 100 set its first record since June the same day, led by chipmakers after early success for Meta’s Muse agent, and the same agent sent banks, insurers, and online travel names lower on disruption fears. The S&P 500 closed flat on September 22.
The 20-day line is still falling while the 50-, 100-, and 200-day lines rise, and 71.4% of the last 21 closes sat under the 20-day.
The financing under the rally moved further down the credit ladder. SoftBank is seeking more than $11 billion in one of the largest junk bond deals ever to fund its OpenAI stake, and Goldman Sachs launched a $1.1 billion junk bond for a Blue Owl data center leased to CoreWeave. Apollo capped redemptions from a private credit fund for a third straight quarter after 14.7% of investors asked to leave. Two initial public offerings were delayed to wait for Anthropic’s debut. The Bank of England’s Sarah Breeden says regulators are running out of time on the risk of AI agents triggering a market meltdown, and Nvidia trades at half its 2025 multiple.
🟠 The index stepped back over its fast line and the Nasdaq printed a record, while the line kept falling and the financing moved into junk.
— Technical Analyst (Lukas Marchetti)
Disclaimer
The information is provided for information purposes only and on the basis that it will not be relied upon. No information contained herein constitutes a personal recommendation or investment advice.
The information (including any expressions of opinion or forecast) has been obtained from, or is based on, sources believed by the author to be reliable, but are not guaranteed as to their accuracy or completeness and should not be relied upon. The information is provided without obligation on the part of the author and on the understanding that any person who acts upon it or changes his investment position in reliance on it does so entirely at his own risk. The information does not constitute an offer to buy or sell or an invitation to make an offer to buy or sell any financial instrument.
Information is current only as at the date it is first posted and may no longer be true or complete when viewed by you. All information may be changed or amended without prior notice.
No representation, warranty or undertaking is given as to the accuracy or completeness of the information by the author and no liability is accepted by the author for the accuracy or completeness of such information. In no event will the author be liable to any person for any direct, indirect, special, or consequential damages arising out of any use of the information, including, without limitation, any lost profits.
You should be aware that the Internet is not a completely reliable transmission medium. The author does not accept any liability for any data transmission errors such as data loss or damage or alteration of any kind, including, but not limited to any direct, indirect or consequential damage, arising out of the use of the product or services referred to herein.
The materials provided here including text, photographs and other images, are protected by copyright and/or other intellectual property rights. All copyright (and any other intellectual property rights) in these materials is either owned by the author, or is used by the author under licence.