


Tape of the Week
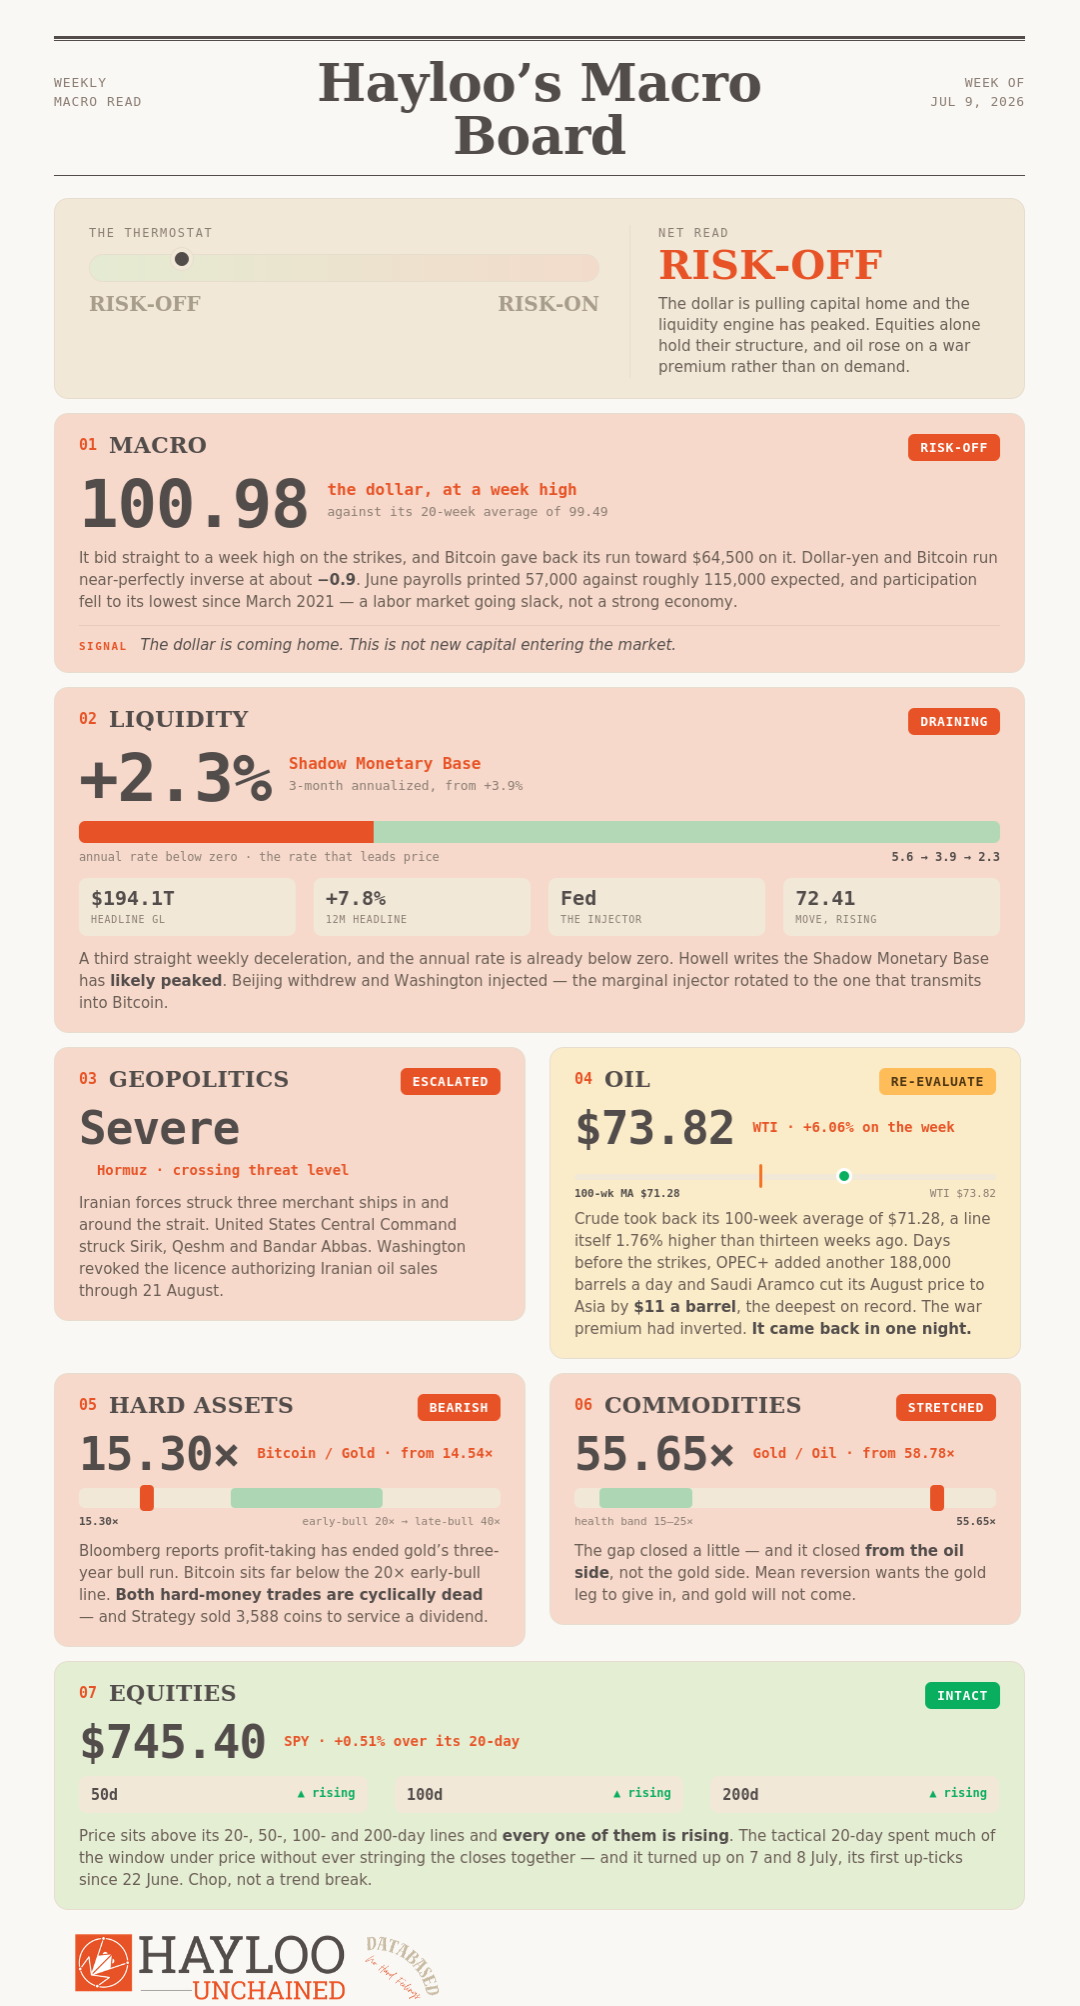
Iranian forces struck three commercial ships in and around the Strait of Hormuz, Washington revoked the licence authorizing Iranian oil sales and bombed Sirik, Qeshm and Bandar Abbas, oil ran 6.06%, and the dollar bid to its highest level of the week at 100.98, nearly a point and a half above its 20-week average.
The S&P 500 and the Euro Stoxx both turned negative on the shock. Bitcoin did not. Bitcoin closed back inside the 60, 000 − 64,000 dealer gamma band and back above the 200-week moving average it lost in June.
Unfortunately, this doesn’t mean much just yet. Global liquidity flows kept draining: Michael Howell’s Shadow Monetary Base decelerated for a third consecutive week, its annual rate remains below zero. The cohort that bought the Bitcoin top is realizing about $280 million of losses a day, the heaviest sell-off since December 2022. Every bottoming condition we’re looking for moved one week further from being met, except for price.
What changed is the shape of the next leg, not its direction. A flush needs a crowd to cascade. There is no crowd in Bitcoin right now. What is left is the slow kind of capitulation — an underwater cohort feeding coins into every bid that appears, day after day, until the bids stop appearing. That is a grind and a second test into late summer. Not a wick.
Macro Tape
The dollar is this week’s whole macro story. It bid straight to a week high at 100.98 on a risk-off regime, with Bitcoin giving back its run toward $64,000. Dollar-yen and Bitcoin run near-perfectly inverse, a correlation around −0.9, which makes the dollar the single most bearish transmission into Bitcoin and Crypto.
Labor Market participation is at its lowest since March 2021, not a sign for a strong economy pulling money out of financial assets. June payrolls printed 57,000 against roughly 115,000 expected, and September rate hike odds halved to about 50% after the weak employment numbers were in.
The yen is the sharp end. It sits pinned near a four-decade low. Tokyo is still holding after a record ¥11.7 trillion of April-to-May defence. That intervention risk sits loaded.
A weak yen is bearish Bitcoin through the inverse correlation. But it also cools rate-hike bets, and that’s supportive.
🔴 This week’s macro tape remains risk-off.
— Chief Macro Strategist (Theodore Brennan)
Liquidity Tape
This week, the liquidity composition changed. Three weeks running, the headline was carried by Chinese liquidity injections. This week Beijing withdrew and Washington injected. Fed liquidity drives Bitcoin, People’s Bank of China (PBoC) liquidity drives gold.
At Hayloo we split here, and the disagreement is this week’s read. Our liquidity and Macro desks see a composition shift inside a draining system: the Shadow Monetary Base (SMB) decelerated, and the engine’s direction is what will drive markets this autumn. Our Capital Flow and Fundamental Research Analysts see the Fed’s return as the leading indicator of a Bitcoin bear market invalidation, arriving a quarter ahead of the price.
In either case, investors can either feel reassured that policy-makers are active, or concerned that markets need support by policymakers. We do not resolve this by hierarchy. We watch the next print more closely, repeating what we said a couple weeks back: “A Bitcoin bottom and a 20% wash-out have co-existed before.”
🔴 This week’s liquidity tape reads risk-off.
— Global Liquidity Director (Julian Harlow)
Geopolitical Tape
For a month we have carried one asymmetry: the Strait of Hormuz is cheap to close and expensive to reopen. It closed. Iranian forces struck three merchant ships in and around the strait; United States Central Command struck Sirik, Qeshm and Bandar Abbas; Washington revoked the general licence authorizing Iranian oil sales through 21 August; a US-led naval coalition raised the crossing threat level to severe.
🔴 This week’s geopolitical landscape escalated.
— Geopolitical Intelligence Officer (Margaux Lindqvist)
Commodity Tape
WTI spot sits at $73.82, up 6.06% on the week, and 3.56% above its 100-week moving average of $71.28. That average is itself 1.76% higher than it was thirteen weeks ago.
The reason to be careful came four days prior: OPEC+ ratified a further 188,000 barrels a day for August. Brent’s six-month spread flipped into contango for the first time this year.
Saudi Aramco cut its August Arab Light price to Asia by $11 a barrel — the largest cut in the record back to 2003, and its first below-benchmark Asian price since the March 2020 price war.
That is a producer capitulating on price to defend share into a glut its own output hikes helped build. The war premium did not merely unwind; it inverted. Then it came back in one night.
🟠 This week’s oil price begins repricing in a war premium.
— Inflation & Real Asset Analyst (Sienna Whitfield)
Hard Assets
Gold/Oil narrowed to 55.65× from 58.78×. For the first time in a month the compression came from oil rising rather than gold falling. That distinction is the entire read.
Bloomberg reported this week that profit-taking has ended gold’s three-year bull run, with little evidence of investors building large shorts in anticipation. Our read: the debasement thesis is intact on a decade horizon and cyclically dead. That is exactly what our architecture assumes, and exactly what makes this a buying window rather than a thesis break.
Bitcoin/Gold sits at 15.30×, up from 14.54×, below the 20× early-bull band.
On 6 July Strategy disclosed it had sold 3,588 BTC — consuming more than 17% of its $1.25 billion authorization in a single week, with proceeds funding preferred-stock distributions and replenishing a $2.55 billion dollar reserve. Holdings fell to 843,775 BTC at a $74,476 average, roughly $11.4 billion underwater. Its preferred, STRC, trades at $86.17, $13.83 below par, and the financing engine restarts only if that gets back to par. The largest corporate holder just flipped from the marginal bid to the marginal seller, and it is selling coins to service a dividend.
🔴 This week’s hard-asset read is a debasement basket flushing to the dollar.
— Hard Asset Strategist (Marcus Vasquez)
Equity Tape
The equity surface is the macro sword hanging over Bitcoin, and this week it did nothing at all. SPY sits at $745.40, 0.51% above its 20-day moving average of $741.60. The 50-, 100- and 200-day lines are all rising with price at or above them, and persistence sits at zero at every horizon.
Underneath, the tactical 20-day carries 62% occupancy below at −1.12% mean depth — but it is inflecting. Its 21-session slope is still −0.30, and the line ticked up on 7 and 8 July, its first up-ticks since 22 June.
A quiet reading is not an all-clear; it is a characterization. The characterization is that the structure never cracked — through a Micron washout, through a Samsung miss, and through a report that DeepSeek is building its own artificial-intelligence inference chip. That last one is the fundamental case for the capital-expenditure crack widening: the biggest buyers of compute are turning into their own suppliers. The market shrugged. The substrate hardened.
🟢 This week’s equity tape holds its structural uptrend.
— Technical Analyst (Lukas Marchetti)
On-Chain Tape
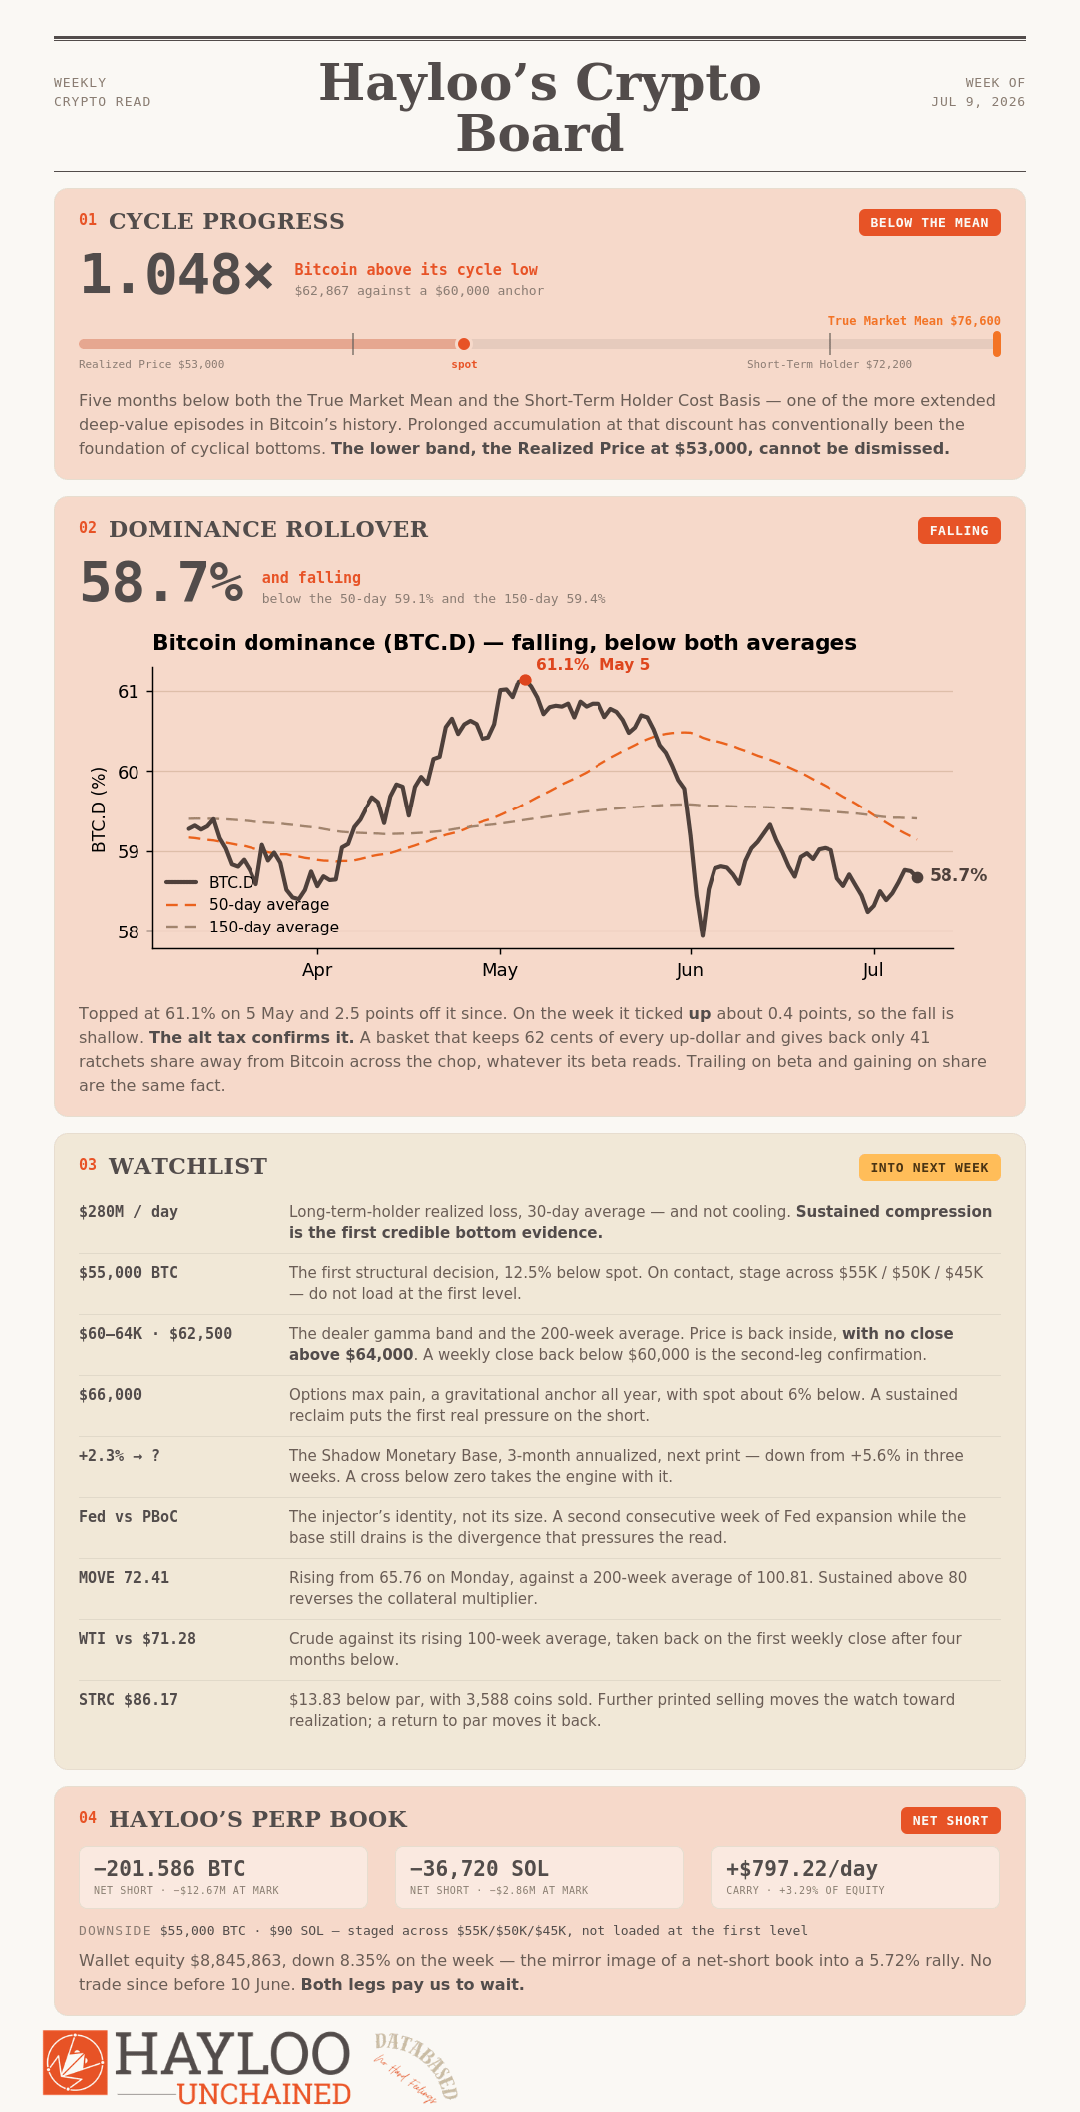
Cycle Progress. Bitcoin spent five months below both the True Market Mean at $76,600 and the Short-Term Holder Cost Basis at $72,200 — one of the more extended deep-value episodes in its history.
Prolonged accumulation at that discount has conventionally been the foundation of cyclical bottoms. However, the Realized Price at $53,000 remains a possibility that cannot be dismissed.
A flush requires long liquidations, and there is not a crowded long book to liquidate. In the bulls’ absence, early conditions for a Bitcoin and Crypto bottoming process are taking shape, but the confirmation signals have not arrived.
Long-term-holder loss realization has grown from 15% of total realized value in early February to 43% today — investors who acquired near the high, held through months of drawdown, and are exiting as the bear stretches past their conviction threshold. That is why every recovery attempt meets a fresh wave of distribution. The entity-adjusted long-term-holder realized loss, on a 30-day average, printed a new peak near $280 million a day, the highest since December 2022.
This is a clean forward gauge of sell-side exhaustion, mapping onto real capitulation, and our read is “not yet.”
Around it, the positioning surface loosened. Put/call open interest sits at 0.56, the lowest of 2026 — two calls for every put. Implied volatility is near a twelve-month low, and the surface still skews defensive — but it pays materially less to be there.
At Hayloo we are split, and the split is the point. Our Technical Analyst and the alt desk read the absent long book as the reason for another Bitcoin leg down, shallow and slow — a grind toward $55,000 rather than a wick to $45,000. Fundamental Research and Capital Flow read $280 million a day of long-term-holder loss realization as the flush already happening. We can’t resolve the disagreement but here’s what we’re looking for: whether that realized loss curve compresses, and whether spot demand absorbs it. It enters our watchlist as the primary on-chain condition to watch.
🔴 This week’s on-chain read is accumulation beneath a cohort that will not stop selling — a floor tested, not built.
— Capital Flow Analyst (Priya Sandoval) · Fundamental Research Analyst (Charlotte Donovan)
Hayloo’s Perp Book
Size and direction. Our perp book remains net short, collateralized by a structural spot long.
Funding Rate Carry. +$797.22/day, +$290,984 annualized: +3.29% of equity, rising. Our shorts are paid to wait.
Next levels that fire. Downside: $55,000 Bitcoin is the first structural decision.
The reclaim that reverses any of it is a weekly close back above the 60, 000 − 64,000 gamma band.
— Lead Trader (Jordi Federer)
🔴 Hayloo’s perp book is net short, collateralized by spot long, and paid funding rate income to hold the line.
Hayloo’s Alt Tax
Beta measures how much a coin moves for each move in Bitcoin. A beta of 1 means it tracks Bitcoin one-for-one; above 1 it amplifies Bitcoin’s moves, below 1 it dampens them. We split that into up-capture (β⁺, how much a coin catches on Bitcoin’s green days) and down-capture (β⁻, how much it gives back on the red days) — when the two differ, there’s an asymmetry, and we watch whether that gap is widening or closing. When the asymmetry is negative, that is the alt tax.
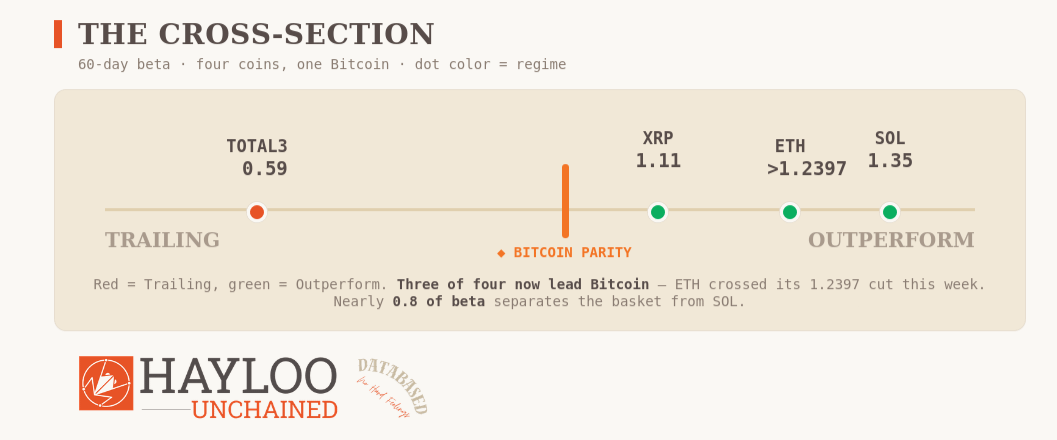
This week, for the first time in the recorded series, all four names we track carry a favorable asymmetry — and every one of those gaps is widening rather than closing. The pattern that precedes a turn is a gap collapsing toward zero. This is not what we’re seeing.
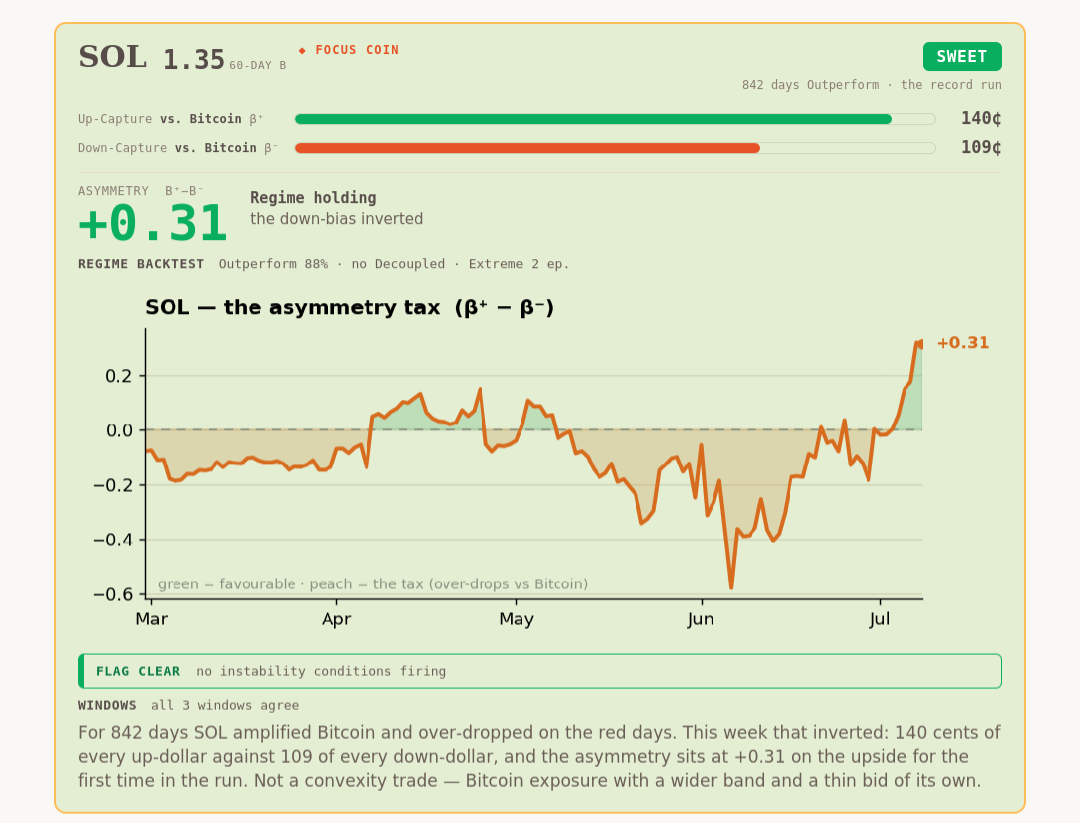
SOL — leading for 842 days, and this week the story turned. For 842 days SOL has amplified Bitcoin as a high-beta name, and for most of that run it carried a structural down-bias: it over-dropped on the red days. This week that inverted. The asymmetry is +0.31, with up-capture now above down-capture for the first time in the run.
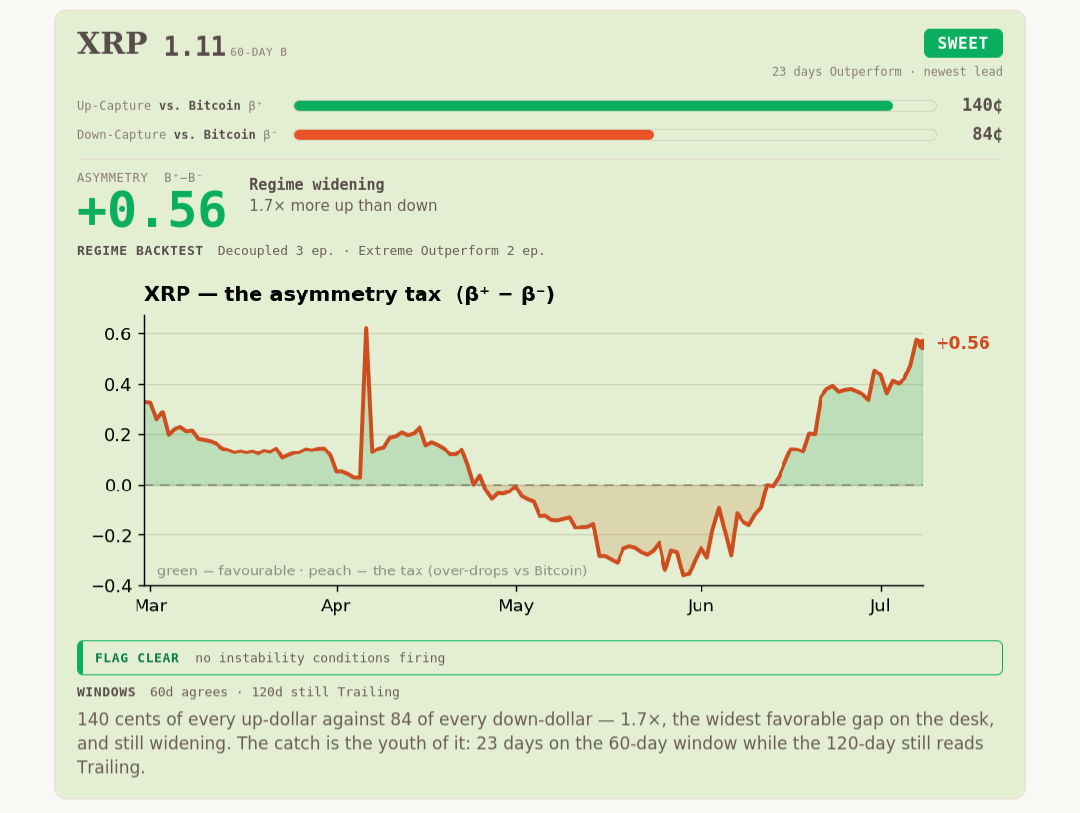
XRP — leading for 23 days. Of every up-dollar, 140 cents; of every down-dollar, 84 — 1.7× more upside than downside, the widest favorable gap on the desk.
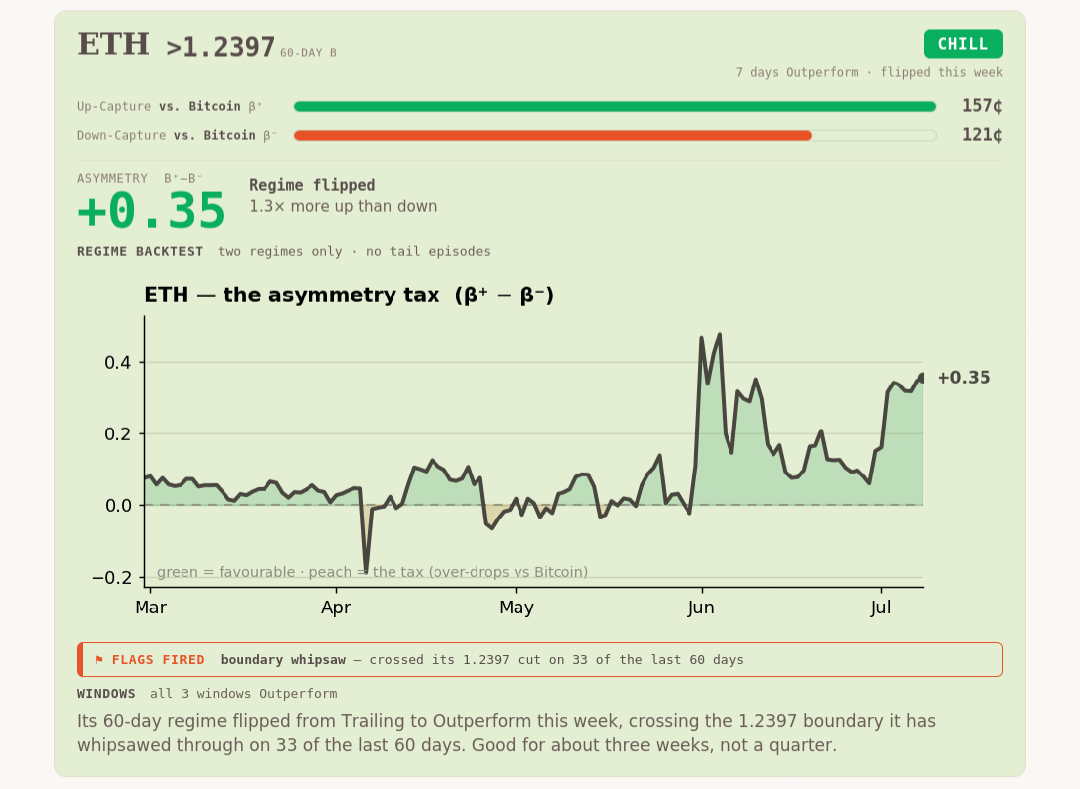
ETH — leading for 7 days. Of every up-dollar, 157 cents; of every down-dollar, 121. The gap widened to +0.35. Its 60-day regime flipped from Trailing to Outperform this week, crossing the 1.2397 boundary — a boundary its beta has whipsawed through on 33 of the last 60 days. That fresh crossing is the signal.
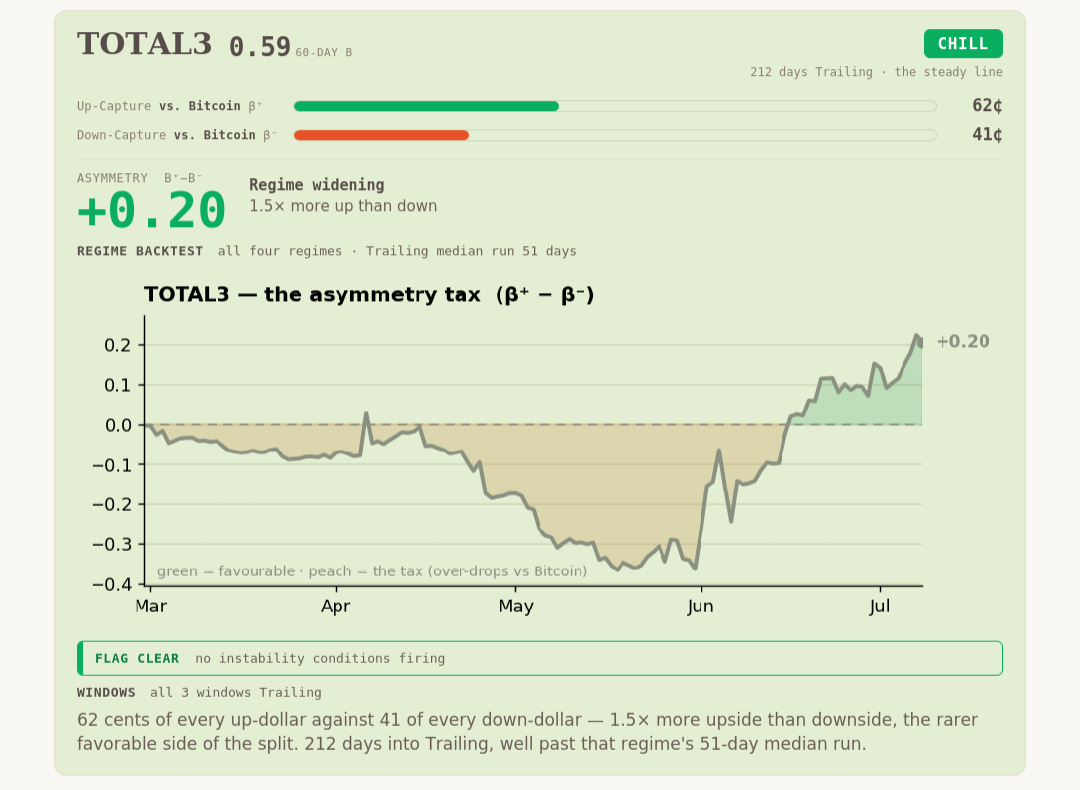
.TOTAL3 — trailing for 212 days. Of every dollar Bitcoin gained, the basket captured 62 cents; of every dollar it lost, it gave back 41 — about 1.5× more upside than downside, the rarer favorable side of the split. The gap widened to +0.20. The basket is 212 days into Trailing, well past that regime's 51-day median run, and all three windows agree.
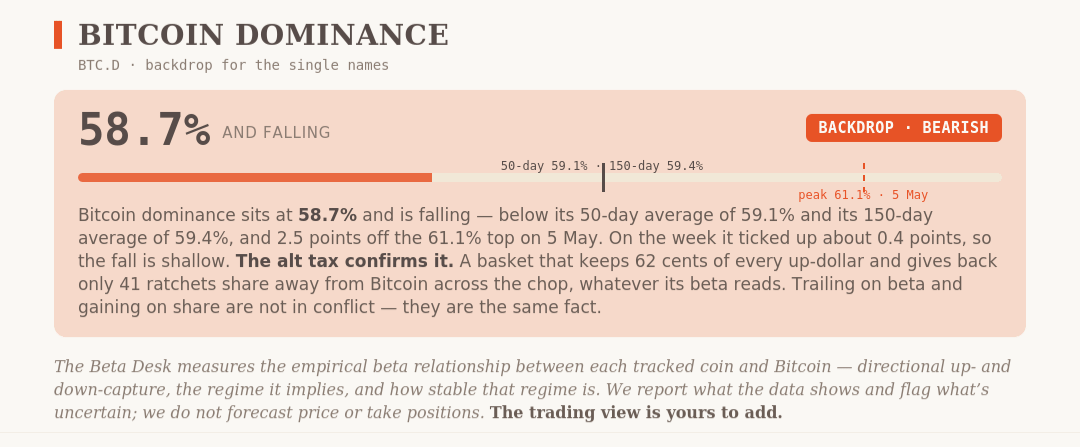
🟠 Capital is draining out of Bitcoin.
Forward Thesis
Our read for the next four to twelve weeks is lower-to-choppy, with the deepest price-headwind window still late August 2026 — Howell’s late-May Shadow Monetary Base trough plus his thirteen-week transmission lag. His flash index, bottoming from that same late-May weakness, confirms the anchor rather than moves it. The Warsh Fed has removed the easing bias and is letting markets do the tightening. Long-term holders are liquidating into every rally at the fastest pace since 2022, and that pressure has not begun to cool.
What changes is the character of the expected move, and we revise it explicitly rather than restating last week with new dates. There is no leveraged long book to cascade. What is left is the slow kind of capitulation — an underwater long-term cohort selling $280 million a day into whatever bid appears — and that produces a grind and a second test, not a wick.
What would change our mind — four named conditions, none present today.
Howell’s Shadow Monetary Base 3-month annualized inflecting clearly positive, non-base-effect, with the annual rate turning up at the same time. It is +2.3% and falling, explicitly base-effect-flattered, with the annual rate below zero.
The Realized Profit/Loss Ratio sustained above 2.0 across multiple weeks, with confirmed accumulation. It is −0.7, improved from −1.2, still deeply negative.
A Bitcoin weekly close above $66,000 with sustained spot demand.
Ten consecutive S&P 500 closes below the 20-day moving average. This condition fires toward escalation, not relief.
If two conditions appear simultaneously, we re-evaluate the position on the next weekly.
Watchlist
Long-term-holder realized loss, 30-day average — about $280 million a day and not cooling. The primary on-chain condition, and the one that displaced fund flow. Sustained compression toward prior baselines is the sell-side-exhaustion tell and the first credible bottom evidence.
Bitcoin $53,000 — the first structural decision.
The 60, 000 − 64,000 dealer gamma band and the $62,500 200-week moving average — price is back inside the band and above the 200-week line, but there has been no close above $64,000. A weekly close back below $60,000, with the loss curve still elevated, is the second-leg confirmation.
Bitcoin $66,000, the options max pain — a sustained reclaim turns the near-term options read constructive and puts the first real pressure on the short above the band.
Howell’s Shadow Monetary Base 3-month annualized, next print — +2.3% and decelerating from +5.6% in three weeks.
The injector’s identity, not just its size — the PBoC withdrew and the Fed injected, and Fed liquidity drives Bitcoin. A second consecutive week of Fed expansion with the Shadow Monetary Base still draining is the shape of the divergence that puts our standing read under pressure.
The MOVE index — 72.41 and rising from 65.76 on Monday, against a 200-week average of 100.81. Sustained above 80 reverses the collateral multiplier and takes the headline liquidity number with it.
WTI against its rising 100-week moving average, $71.28
STRC and Strategy — the preferred at $86.17, $13.83 below par; 17% of the sell authorization consumed in a week.
The Team
Jordi Federer — Lead Trader. Owns the book and the publication. Sizing, staging, and every decision that moves capital.
Theodore Brennan — Chief Macro Strategist. Central-bank reaction functions, the dollar, and the rate path.
Julian Harlow — Global Liquidity Director. The liquidity engine, the collateral multiplier, and the transmission lag into price.
Margaux Lindqvist — Geopolitical Intelligence Officer. State behavior, escalation mechanics, and the tails that reprice commodities.
Marcus Vasquez — Hard Asset Strategist. Gold, the debasement basket, and the hard-money ratios.
Sienna Whitfield — Inflation & Real Asset Analyst. Energy, the inflation impulse, and the real-asset complex.
Priya Sandoval — Capital Flow Analyst. Fund flows, positioning, derivatives, and where the marginal dollar comes from.
Charlotte Donovan — Fundamental Research Analyst. On-chain cohorts, cost bases, and the structural read beneath the tape.
Lukas Marchetti — Technical Analyst. Market structure, moving-average regimes, and the levels that fire.
Disclaimer
The information is provided for information purposes only and on the basis that it will not be relied upon. No information contained herein constitutes a personal recommendation or investment advice.
The information (including any expressions of opinion or forecast) has been obtained from, or is based on, sources believed by the author to be reliable, but are not guaranteed as to their accuracy or completeness and should not be relied upon. The information is provided without obligation on the part of the author and on the understanding that any person who acts upon it or changes his investment position in reliance on it does so entirely at his own risk. The information does not constitute an offer to buy or sell or an invitation to make an offer to buy or sell any financial instrument.
Information is current only as at the date it is first posted and may no longer be true or complete when viewed by you. All information may be changed or amended without prior notice.
No representation, warranty or undertaking is given as to the accuracy or completeness of the information by the author and no liability is accepted by the author for the accuracy or completeness of such information. In no event will the author be liable to any person for any direct, indirect, special, or consequential damages arising out of any use of the information, including, without limitation, any lost profits.
You should be aware that the Internet is not a completely reliable transmission medium. The author does not accept any liability for any data transmission errors such as data loss or damage or alteration of any kind, including, but not limited to any direct, indirect or consequential damage, arising out of the use of the product or services referred to herein.
The materials provided here including text, photographs and other images, are protected by copyright and/or other intellectual property rights. All copyright (and any other intellectual property rights) in these materials is either owned by the author, or is used by the author under licence.