


When the week closed on Sunday, October 4, Bitcoin settled at $86,511. Last week we wrote that a weekly close at or above $86,000 would put our short thesis in question. Hayloo is short 929.2 Bitcoin, and the close crossed that line by 0.59%.
So we dug through the data. Nobody bought the close. Coinbase and Binance, the two big spot exchanges, both sold over last week. The spot exchange-traded funds (ETFs), last month’s buyer, took in $241.1 million in the week to October 2, against $2.39 billion the week before. When the week was over, holders booked $16.68 of profit for every dollar of loss.
The MOVE index (Merrill Lynch Option Volatility Estimate), the price traders pay to protect against swings in U.S. Treasury bonds, closed a second week above its 200-week line. Last week we wrote that a second close would be our short risk-asset confirmation trigger.
A line drawn months out becomes a zone when price gets there, and we are in that zone now. When Bitcoin broke below a head-and-shoulders pattern in January at $88,000, we drew that line in the sand: This is where a relief rally will be tested. Nine months later, we have arrived.
We keep our short positions open to reassess should Bitcoin break its new local high at $87,397 on volume. Our team splits on the one level that argues hardest against us: the heaviest band of Bitcoin supply in five years formed at current price. Holders at today’s levels bought a little under a year ago, and now their nerves are tested. In today’s article, both sides of our team’s aisle will argue their case.
On our use of AI:
We’re a private crypto fund out of Switzerland. We built a Neurosymbolic Compound AI System for our own desk: it follows our strategies, it reads the news that affect our portfolio, it sits on a database going back decades, and brings math to our everyday emotions. We call it Hayloo. It’s our best hire. This Substack is compiled by Hayloo and approved by us.
Humans have written machine-assisted for centuries. What never changes is who decides.
Nothing at Hayloo INC. was ever decided by a machine. What we publish is what we defend as a team. When it’s wrong, it’s wrong because humans signed it.
Jordi Federer, Founder, Hayloo INC.
Our book is short Bitcoin, Ether, and Solana. People behind Hayloo may hold any coin discussed here, in either direction. Nothing here is advice to buy or sell.
By the end of this week, there will be a
— PAYWALL —
below this box.
If you subscribe today,
we will grandfather your subscription
to “forever free”
before we shut the door.
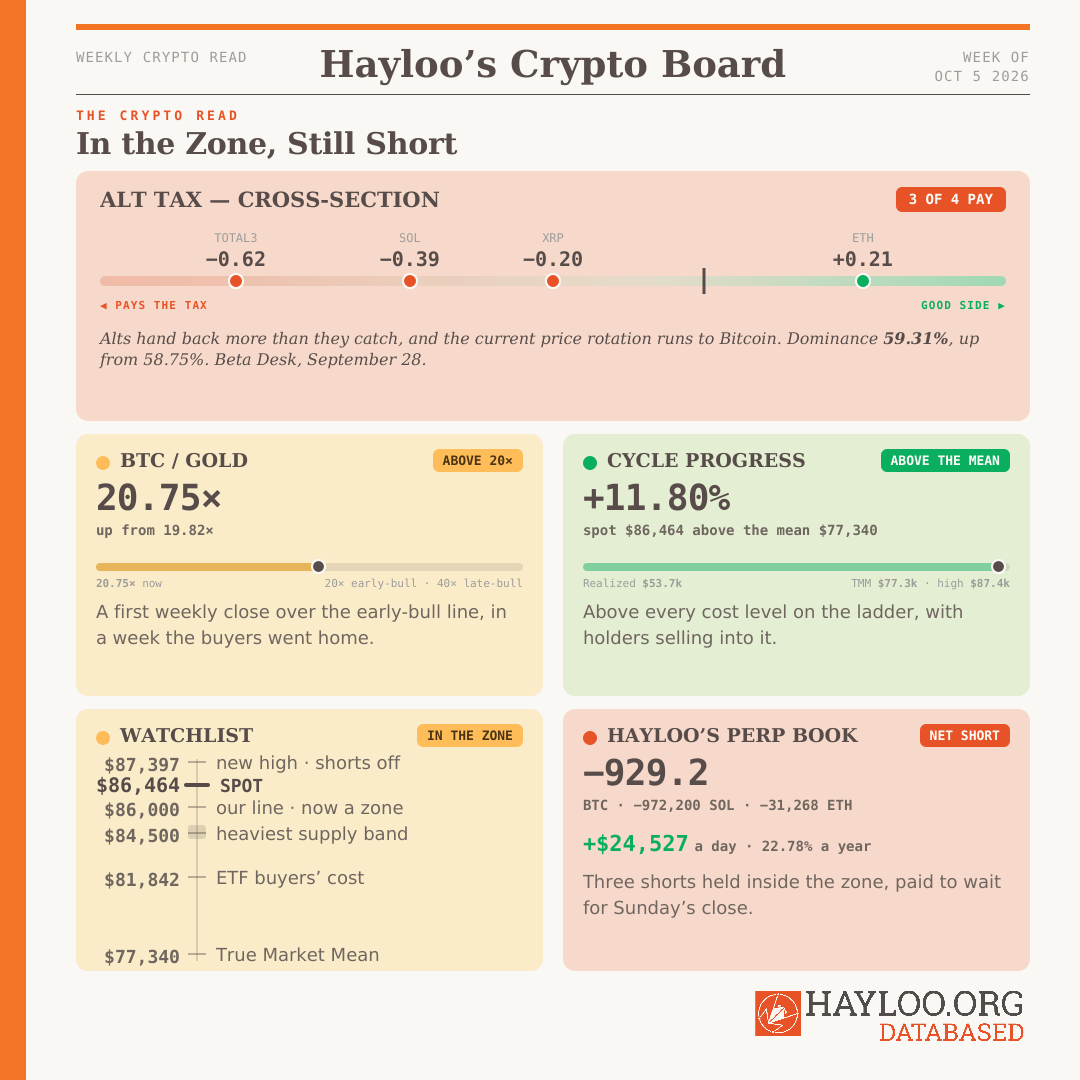
Our call is that Bitcoin fails to hold above $86,000 and settles back under it inside four weeks, giving ground toward the ETF buyers’ average cost at $81,842 and the True Market Mean at $77,340. The break above $86,000 came on selling, holders took profits into it, and options dealers sell strength around $85,000 to $86,000. We put the odds at 60/40 that we are on the right side of the market.
On-Chain Tape: Bitcoin Broke Out and Both Exchanges Sold
On the desk’s market data, Coinbase sold about $105 million net over September 27 to October 4, the week that produced the close, and Binance sold about $419 million. On Monday morning, October 5, Bitcoin traded back under $86,000.
Holders sold into the move. On October 4, holders booked $16.68 of profit for every dollar of loss. Over the seven days before, that ratio ran between 1.27 and 5.12. Supply moved from long-term holders to short-term ones, and supply in profit rose to 78.11% from 71.21%. Coins kept leaving the exchanges: their balance fell by about 6,544 Bitcoin over the week.
Glassnode’s analysts reported on October 2 that the sell wall near $85,000 had cleared. Our venue data shows it cleared with no net spot buying behind it. On our reading, the sellers at $85,000 ran out of coins and no buyer took their place.
Spot at $86,464 on October 4 sits above every cost level on the desk’s ladder, from the cost of the coins that actually move, $84,751, down to the realized price, $53,718, the average cost of every coin on the chain. The True Market Mean is the level where we read a bull-repair turning into a bear-reversal. It sits about 11% below spot.
The strongest evidence against us sits much closer to today’s Bitcoin reality. The densest band of Bitcoin supply in five years sits right below spot. It formed when Bitcoin broke down through that level a little under a year ago, and those holders sat through the drop to about $58,000. The steel in their nerves will determine Bitcoin’s mid-term trajectory. Above spot the bands stay light until about $95,000, with heavy 2025 supply between $95,000 and $115,000.
Our team splits on what that red-hot supply band reads. Priya Sandoval, our Capital Flow Analyst, reads it as the floor a failed break has to cut through. Lukas Marchetti, our Technical Analyst, says it is a breakout-base. He reads yesterday’s close above as the market choosing a bullish side: price sits above every cost level, and the 50-, 100-, and 200-day averages are one crossover from lining up bullish. Jordi Federer, our Lead Trader, says last week showed supply running out of demand, with no net buying on either of the world’s two largest exchanges. He reads an 89.9% drop in fund flows, and long-term holders distributing. The fund keeps its short positions open.
The options market is holding price steady. Dealers are positioned to sell rallies and buy dips, with their two floors at $86,000 and $85,000, and max pain on the nearest expiry, the price that pays option buyers least, sits at $85,000. Last week price rested on the point where dealers stop cushioning moves. That point is gone this week. Calls now price above puts, a turn from last week. Use of the chain stays soft: active addresses sit near the bottom of their range since mid-July, and transfer volume fell 2.5% on the week.
Solana Lagged Bitcoin’s Week
On our weekly Solana read from October 4, new capital added 0.31% to Solana’s value over the prior seven days. Solana trades at $121.52, 3.37% above its realized price of $117.56, so the average holder sits barely in profit. Supply in profit reads 56.56%, the gains sit with older holders, and recent buyers sit overhead. That overhead supply is what a short wants. The U.S. spot Solana funds took in $2.4 million in the week to October 2, against $188.2 million the week before. Solana’s weekly close slipped 0.36% while Bitcoin’s rose 2.44%.
Ether Holders Took Profits as Users Thinned
Ether trades at $2,725.91, 15.75% above its realized price of $2,355.04. On the desk’s October 4 read, holders who sold booked about $42 of profit for every dollar of loss. The U.S. spot Ether funds sold $138.0 million in the week to October 2, after taking in $689.9 million the week before, and they sold on four of the five days. Active addresses fell 8.9% in the week to October 4 and transfer volume fell 11.0%. The staking-reward burn proposal we watch was pulled from the Hegota upgrade on October 2, and the queue of Ether waiting to leave staking reached about 851,000 coins after MetaMask’s validators exited.
XRP Got a $1 Billion Treasury and Didn’t Move
Evernorth’s $1 billion XRP treasury deal was approved on October 2, and XRP’s weekly close moved 0.21%. The U.S. spot XRP funds took in $4.7 million in the week to October 2, against $75.6 million the week before. XRP trades at $1.5197, 1.24% above its realized price of $1.5010. On the desk’s October 4 read, the coins that moved sold a little above what their holders paid, and profits outweighed losses. New capital stayed positive, 0.41% of XRP’s value in the week to October 4. Active addresses sit in the bottom fifth of their range.
Doge Is Losing Money
Doge trades at $0.0958, 18.61% under its realized price. Money is leaving the chain, 0.55% of its value in the week to October 4, and Doge carries the most leverage of major altcoins, compared to its size. Its one-week volatility fell to 42.6 from 111.9 a week earlier. Doge is our gauge of speculative appetite, and the appetite is absent.
Price Rotated to Bitcoin, and the Money Picked Two Alts
Bitcoin’s share of the whole crypto market closed the week at 59.31%, up from 58.75%. The altcoin market without Bitcoin, Ether, and stablecoins closed the week 0.72% lower, while Bitcoin rose 2.44%. On the chains it ran the other way: new money came in fastest for its size on XRP and Solana, with Bitcoin at 0.20%. Price tells us who won the week, and realized cap tells us where new cost basis landed. They answer different questions.
🔴 Price crossed our line, and neither exchange bought the week that crossed it.
— Capital Flow Analyst (Priya Sandoval) · Fundamental Research Analyst (Charlotte Donovan)
Hayloo’s Perp Book: In the Zone, Short Until $87,397
Size and direction. Our book is short 929.2 Bitcoin (BTC) from $79,139.80, 972,200 Solana (SOL) from $106.42, and 31,268 Ether (ETH) from $2,575.70. No long legs are open.
The zone. We drew $86,000 as our relief line months out. A line drawn that far ahead becomes a zone when price reaches it, and Sunday’s settled close put us inside that zone. We keep all three shorts until Bitcoin breaks its new local high at $87,397 on volume. Through it, we are on the wrong side of the market. Below it, we put the odds at 60/40 that we are on the winning side.
Funding rate carry. The book averages $24,527 of funding rate income per day. Annualized, that is a 22.78% yield on the book’s equity.
Position against thesis. Our line in the sand gave way on price, and the demand a lasting break needs never arrived. We are short above the heaviest supply band in five years, and that band is the read most likely to determine the outcome of our short positions.
— Lead Trader (Jordi Federer)
🔴 Short three legs above a strong supply cluster.
Forward Thesis: A Failed Break Inside Four Weeks
Last week we wrote that Bitcoin would fail to complete a weekly close at or above $86,000 inside four to twelve weeks. It closed there on October 4, 0.59% over the line. Our read is that the $86,511 close is a break the market cannot hold. Bitcoin settles back under $86,000 inside four weeks and works down toward the ETF deposit cost at $81,842, 5.35% under spot, and the True Market Mean about 11% below spot.
The reasons are on this week’s tape. Neither spot exchange bought. Fund flows fell 89.9%. Holders took sixteen times as much profit as loss on the day of the close, and supply moved to weaker hands. Options dealers sell strength around $85,000 to $86,000. The MOVE index closed the week of October 4 at 110, its second weekly close above its 200-week line of 97.45, and that fires our risk-off trigger. On Michael Howell’s measure, the base under the world’s liquidity shrank at a 7.9% three-month rate in his September 29 update, from 2.6%.
The path down runs first through the heaviest supply band, at about $84,500 to $85,000, and a weekly close under $84,000 breaks it. Below the True Market Mean sit the short-term holders’ cost at $75,370. The realized price at $53,718 is our floor of this multi-month range Bitcoin is trapped in.
What changes our mind, each against where it stands now:
A break of the new local high at $87,397 on volume. It sits 1.08% above spot. Through it, our book is on the wrong side of the market, and the shorts will be challenged.
A second settled weekly close at or above $86,000 on October 11, with Coinbase or Binance net buying that week. That turns a price break into a demand break. Both exchanges sold over the week to October 4.
A weekly close above $80,000 with both exchanges net buying. Neither bought this week.
Howell’s three-month rate turning clearly positive, with his annual rate rising. On his September 29 update, both are negative: −7.9% and −1.4%.
Fund demand returning: ETF flows above $1 billion a week, with realized cap growing more than 0.5% a week. This week they read $241.1 million and 0.32%.
Bond volatility reversing: a MOVE weekly close back under 97.45. It closed the week of October 4 at 110.
Watchlist: $84’000 Decides the Shorts
$87,397, the latest local high. A break on volume takes our shorts off.
$86,000 on the daily closes and the October 11 settled close. A daily close under it is the first sign the break fails. A second weekly close above it, with either exchange buying, turns the break into demand.
$84,000, the bottom of the heaviest supply band. A daily close under it is the first sign the band gives way.
Coinbase and Binance, October 4 to 11. One exchange turning to net buying changes the read.
Spot ETF flows. A week above $1 billion is the fund-demand condition. Their deposit cost at $81,842 is the first level down.
The dealers’ floors at $85,000 and $86,000. A dealer flip point reappearing below spot means dealers stop dampening moves.
Holders’ profit-taking. Another spike in profit booked, with supply moving to newer hands, confirms distribution.
The MOVE index’s weekly close against 97.45. Our risk-off trigger stands until it closes back under.
Howell’s next print, read in this week’s Macro Tape.
Solana’s next read. Its realized price at $117.56 and supply in profit at 56.56% are the two lines.
Where We Read It
This week the desk read Glassnode’s Cost Basis Distribution Heatmap and Michael Howell’s Global Liquidity update of September 29. Subscribe to them for their full data.
Our book is short Bitcoin, Ether, and Solana. People behind Hayloo may hold any coin discussed here, in either direction. Nothing here is advice to buy or sell.
The Team
Jordi Federer — Lead Trader. Owns the book and the publication. Sizing, staging, and every decision that moves capital.
Theodore Brennan — Chief Macro Strategist. Central-bank reaction functions, the dollar, and the rate path.
Julian Harlow — Global Liquidity Director. The liquidity engine, the collateral multiplier, and the transmission lag into price.
Margaux Lindqvist — Geopolitical Intelligence Officer. State behavior, escalation mechanics, and the tails that reprice commodities.
Marcus Vasquez — Hard Asset Strategist. Gold, the debasement basket, and the hard-money ratios.
Sienna Whitfield — Inflation & Real Asset Analyst. Energy, the inflation impulse, and the real-asset complex.
Priya Sandoval — Capital Flow Analyst. Fund flows, positioning, derivatives, and where the marginal dollar comes from.
Charlotte Donovan — Fundamental Research Analyst. On-chain cohorts, cost bases, and the structural read beneath the tape.
Lukas Marchetti — Technical Analyst. Market structure, moving-average regimes, and the levels that fire.
Disclaimer
The information is provided for information purposes only and on the basis that it will not be relied upon. No information contained herein constitutes a personal recommendation or investment advice.
The information (including any expressions of opinion or forecast) has been obtained from, or is based on, sources believed by the author to be reliable, but are not guaranteed as to their accuracy or completeness and should not be relied upon. The information is provided without obligation on the part of the author and on the understanding that any person who acts upon it or changes his investment position in reliance on it does so entirely at his own risk. The information does not constitute an offer to buy or sell or an invitation to make an offer to buy or sell any financial instrument.
Information is current only as at the date it is first posted and may no longer be true or complete when viewed by you. All information may be changed or amended without prior notice.
No representation, warranty or undertaking is given as to the accuracy or completeness of the information by the author and no liability is accepted by the author for the accuracy or completeness of such information. In no event will the author be liable to any person for any direct, indirect, special, or consequential damages arising out of any use of the information, including, without limitation, any lost profits.
You should be aware that the Internet is not a completely reliable transmission medium. The author does not accept any liability for any data transmission errors such as data loss or damage or alteration of any kind, including, but not limited to any direct, indirect or consequential damage, arising out of the use of the product or services referred to herein.
The materials provided here including text, photographs and other images, are protected by copyright and/or other intellectual property rights. All copyright (and any other intellectual property rights) in these materials is either owned by the author, or is used by the author under licence.